Epidemic curve – Wikipedia
The epidemic curve is the graphic representation of the number of cases of a health disease or event depending on time, in a population, a place and for a given period.
Essential descriptive stage of an epidemiological survey, the epidemic curve constitutes a reflection of the dynamics of the epidemic: it makes it possible to visualize the beginning, the maximum and the end of the epidemic, to follow its evolution, and thus to assess the effectiveness of control measures; It also makes it possible to make assumptions on the transmission mode of the incriminated agent, its incubation time as well as to calculate the period of exposure to this agent.

The epidemic curve represents the number of cases of a disease depending on time. It is most often represented by a histogram in an orthogonal benchmark; There is therefore no space between adjacent columns [ first ] , [ 2 ] , [ 3 ] .
There are variants, each case can be represented by a box, which allows, if necessary, to distinguish by the assignment of different colors or patterns certain characteristics of the cases: confirmed cases, probable cases, secondary cases, deceased cases, different phylogenetic strains identified in the epidemic, different places of origin of cases, etc. [ 3 ] .
Abscissa [ modifier | Modifier and code ]
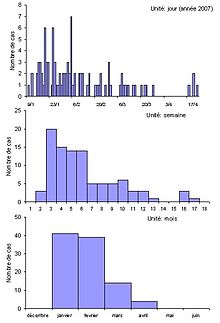
The time scale is represented in abscissa and its unit can vary from one curve to another: time, day, week …
By convention, the unit of time used in epidemic curves must be between a third and one eighth of the incubation period of the disease. If the incubation time is not known, several epidemic curves must be made with different time units and choose the most informative [ 2 ] , [ 4 ] , [ 5 ] , [ 6 ] , [ 7 ] .
Likewise, the time scale of an epidemic curve must start before the start of the epidemic episode, to highlight, if applicable, the basic endemic level of the disease, and continue beyond the end of the epidemic. It is recommended to use a period before and after the epidemic curve equivalent to twice the incubation duration of the disease, or one to two weeks if the latter is unknown.
The appearance of the epidemic curve is sensitive to the choice of the unit of time used in abscissa. Inappropriate temporal aggregation may therefore mask certain important details for the interpretation of the curve [ 5 ] , [ 7 ] .
Orderly [ modifier | Modifier and code ]

In order are represented the number of incident cases which correspond to the date in abscissa. Some variants can represent the cumulative number of cases or attack rates [ first ] .
The curve of cumulative cases is of logarithmic; It reflects the speed of appearance of new cases depending on time.
The attack rate is calculated from the number of cases divided by the number of people exposed. It therefore requires that this last value be known.
Events can be deducted, most often by start date of symptoms but sometimes also by diagnostic date or by date of declaration [ 3 ] .
Geographic aspect [ modifier | Modifier and code ]

With constant abscissa and ordinate scales, the appearance of the curve of the same epidemic may change depending on the place of collection of cases.
The number of epidemic foci can guide the type of transmission of the epidemic. Indeed, an epidemic which presents multiple foci will evoke an epidemic by propagation while a common source will be rather associated with a single or limited location, with possibly an extension by contiguity [ 3 ] , [ 4 ] . However, this rule is not absolute. There are many examples of multifocal epidemics linked to contaminated foods at the level of their production site which are transported and distributed remotely from the source [ 3 ] .
The epidemic curve can give a number of information on the epidemic.
Characteristics of an epidemic curve [ modifier | Modifier and code ]
The extent [ modifier | Modifier and code ]
That is to say the interval between the first case and the last case, makes it possible to estimate the total duration of the epidemic.
In the case of an epidemic of a punctual common source, this extent gives an estimate of the minimum and maximum incubation incubation periods of the accused agent, if the date of exposure is known [ first ] .
The median [ modifier | Modifier and code ]
The median divides the epidemic curve into two halves of the same effective. We are more precisely interested in the date of occurrence of the median case.
In the event of an epidemic of a punctual common source, the duration of median incubation of the disease may be estimated by the period between the exposure and the median of the epidemic curve [ 4 ] , [ 5 ] , [ 8 ] .
The existence of an isolated case ( ‘ outliers » ) [ modifier | Modifier and code ]
It can be a case unrelated to the epidemic episode; He can then represent the basic level of the disease in the population [ 2 ] , [ 6 ] .
It can also be the index case: subject with a much shorter incubation period than the others or source subject at the origin of the contamination of other people, who are then secondary cases.
In the latter case, the period between this case and the start (or the median) of the curve then makes it possible to estimate the incubation duration of the disease [ 2 ] , [ 6 ] , [ 9 ] .
The mode [ modifier | Modifier and code ]
The dominant mode or value of a statistical series is the value that has the greatest workforce. A distribution is unimodal if it presents a maximum marked, a peak, which corresponds to the mode. If there are several relative maximums, the distribution is then plurimodal.
The mode allows you to guide the type of transmission: Unimodal: Punctual common source, plurimodal: transmission of person to person or vector (epidemics by spread), and platform: common source continuous [ 6 ] , [ ten ] .
If the curve has several peaks, the average value of time elapsed between the different peaks makes it possible to calculate the intergenerational interval. This interval makes it possible to approach the duration of the reproduction cycle: average duration between the occurrence of the infection in two separate subjects, the first being the source of the infection of the second. If the incubation period and the infectious period are almost similar, then the peaks on average are separated by a period corresponding to the duration of the incubation [ 6 ] .
The slope of the tangent at a point of the curve and its sign [ modifier | Modifier and code ]
It makes it possible to calculate the speed of appearance of new cases and, by its sign, to give an idea of the growth or decrease of the in progress epidemic.
Indeed, when a variable is a function of time, the instantaneous speed of variation of this variable is given by its derivative.
The calculation of the derivative graphically amounts to looking for the slope of the tangent at the curve representative of the function at this point.
Transmission type [ modifier | Modifier and code ]
The analysis of the general appearance of the curve makes it possible to develop hypotheses on the mode of transmission of the causal agent [ first ] , [ 2 ] , [ 3 ] , [ 5 ] , [ 6 ] , [ 8 ] , [ 9 ] :
From an epidemiological point of view, we can distinguish the following types of transmission, which are associated with a characteristic profile of epidemic curve.

Punctual common source [ modifier | Modifier and code ]
The members of the population at risk are exposed to the Causal agent over a short period; The number of cases increases rapidly, reaches a summit, then decreases gradually. This results in an asymmetrical curve in which the mode is shifted to the left of the center. The epidemic curve in this type of transmission generally follows a log-normal distribution [ 11 ] .

Source commune continue [ modifier | Modifier and code ]
The exposure is then prolonged (by convention, it exceeds the incubation time of the disease); The rapid ascent of the number of cases is followed by a phase on the set; The gradual decrease in the number of cases only occurs when exposure ceases.

Intermittent common source [ modifier | Modifier and code ]
The curve shows an irregular profile; The cases, grouped or not, occur at variable intervals which reflects repeated exhibitions.
It is difficult in this last type of profile to determine whether the source is common with irregular emission or if the sources are multiple and varied. The time difference between cases could also suggest a person transmission from person to person separated from an incubation period, but successive peaks do not increase in size and do not merge, as would be the case during a infectious propagation where a person affected in infected several.

Propagation epidemic ( ‘ propagated outbreak » ) or disseminated transmission [ modifier | Modifier and code ]
It is characterized by a curve with multiple peaks at the heights of several waves of increasing amplitude; The decrease is slow.
This type of profile is found in interhuman transmission diseases: the epidemic is propagated from person to person but also in vector transmission diseases.
The modes of transmission can also be associated or succeeded in the same epidemic, for example common common source associated or followed by an interhuman transmission [ 3 ] , [ 7 ] .
Incubation [ modifier | Modifier and code ]
This is the interval that extends between the acquisition of the infection (contact with the agent) and the appearance of the first symptoms [ 4 ] , [ 5 ] , [ ten ] , [ 11 ] , [ twelfth ] .
The epidemic curve is closely linked to the incubation time.
The incubation time varies individually and the incubation time to incubate an illness in an exposed population corresponds to a log-normal distribution curve described by Sartwell [ 4 ] , [ 11 ] , [ twelfth ] .
The incubation period is characterized by a minimum, an average and a maximum. Average incubation can be expressed by arithmetic, geometric or median averages of the distribution curve values [ 5 ] , [ 11 ] , [ twelfth ] .
The variation in incubations is similar for the same disease. The dispersion is independent of the average duration of the incubation period. The dispersion, however, seems less important for viral and wider diseases in bacterial or parasitic diseases [ 11 ] , [ twelfth ] .

- In the case of a punctual common source, the epidemic curve therefore represents the distribution of incubation periods. Indeed, all cases of the curve extend over a period corresponding to the incubation period. The first cases, at the start of the curve, are the subjects with the shortest incubation time. The other cases are distributed according to the variability of the incubation time in the different infected people. The median of the curve then corresponds to the median incubation time [ 4 ] , [ 6 ] , [ 8 ] , [ 11 ] , [ twelfth ] . Under these conditions, the analysis of the epidemic curve makes it possible to estimate the incubation period and/or the exposure period.
- If the date of exposure is known, the deadline between exposure and the peak of the curve (mode) or the date of occurrence of the median case represents the duration of median incubation [ 2 ] , [ 3 ] , [ 4 ] , [ 5 ] , [ 8 ] . The deadlines between exposure and respectively the first and last case of the epidemic curve make it possible to estimate the periods of minimum and maximum incubation [ 3 ] .
- Conversely, the curve makes it possible to identify the exposure period by applying the minimum and maximum incubation periods of the disease, if they are known, respectively on the dates of the first and last cases of the epidemic.
- If the common source is continuous, the extent of the epidemic curve then exceeds the maximum of the incriminated agent’s incubation period. Information on incubation or exposure periods cannot therefore, as before, be obtained [ 11 ] , [ twelfth ] .
- In propagation transmission, the extent of the curve represents the maximum time of incubation several times. However, in this case, if the incubation period and the infectious period are roughly similar, the peaks, on average, are separated at the start of the epidemic, by a period corresponding to the duration of the incubation [ 6 ] , [ 11 ] .
- Rosenberg P. Epidemic curve. In: Gail M, Bénichou J editors. Encyclopedia of epidemiologic methods. New York: Wiley; 2000. p. 352-3.
- TOROK M. EPIDEMIC CURVES. Focus on Field Epidemiology (1): 5 [Online]. Available on: < http://cphp.sph.unc.edu/focus/vol1/issue5/index.htm >
- DESENCLOS J, Vaillant V, Delarocque ATTAGNEAU E, CAMPESE C, CHE D, COIGNARD B et al. The principles of the investigation of an epidemic in a public health purpose. Med Mal Infect 2007; 37: 77-94
- Lilienfeld D, Stolley P, Lilienfeld A. Foundations of epidemiology. 3rd ed. New York: Oxford University Press US; 1994. p.38-47.
- Gerstman BB. Outbreak investigation. In: Epidemiology kept simple: an introduction to traditional and modern epidemiology. Second ed. New York: Wiley; 2003. p.351-82.
- Page RM, Cole GE, Timmreck TC. Investigating an outbreak. In: Basic epidemiological methods and biostatistics: a practical guidebook. Boston – London: Jones & Bartlett; 1995. p.307-414.
- Magnus M. Outbreak investigations. In: Essentials of infectious disease epidemiology. Boston- London: Jones & Bartlett; 2008. p.43-62.
- Dwyer D, Groves C. Outbreak epidemiology. In: Nelson K, Williams C editors. Infectious disease epidemiology: theory and practice. Second ed. Boston – London: Jones & Bartlett; 2007. p.147-79.
- Reintjes R, Zanuzdana A, Krickeberg K. Outbreak investigations. In: Krämer A, Kretzschmar M editors. Modern infectious disease epidemiology: concepts, methods, mathematical models, and public health. New York: Springer; 2010. p.159-76.
- Farrington C. Communicable diseases. In: Gail M, Bénichou J editors. Encyclopedia of epidemiologic methods. New York: Wiley; 2000. p.218-39.
- Sartwell PE. The incubation period and the dynamics of infectious disease. Am. J. Epidemiol 1966; 83: 204-6
- Sartwell PE. The distribution of incubation periods of infectious disease. 1949. Am. J. Epidemiol 1995; 141: 386-9
Related articles [ modifier | Modifier and code ]
external links [ modifier | Modifier and code ]
Recent Comments