2005 Cumbria County Council election
From Wikipedia, the free encyclopedia
|
All 84 seats of Cumbria County Council 43 seats needed for a majority |
|
|---|---|
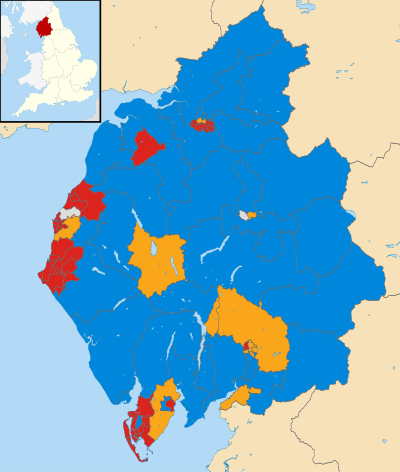
Map showing the results of the 2005 Cumbria County Council elections. |
|
|
|
Elections to Cumbria County Council were held on 5 May 2005. This was on the same day as other UK county council elections. The Labour Party lost their majority and the council fell under no overall control.
Results[edit]
Results by electoral division[edit]
Allerdale District[edit]
Aspatria & Wharrels[edit]
Bowness Thursby & Caldbeck[edit]
Cockermouth East[edit]
Cockermouth West[edit]
Dearham and Broughton[edit]
| Party | Candidate | Votes | % | |
|---|---|---|---|---|
| Labour | Alan Clark | 2,031 | 59.0% | |
| Conservative | Christopher Harris | 1,412 | 41.0% | |
| Majority | 619 | 18.0% | ||
| Turnout | 3,443 | 64.9% | ||
| Labour hold | ||||
Harrington, Clifton and Stainburn[edit]
Keswick & Derwent[edit]
Maryport East[edit]
Maryport West[edit]
Moorclose[edit]
Moss Bay[edit]
Seaton[edit]
Solway Coast[edit]
St John’s[edit]
| Party | Candidate | Votes | % | |
|---|---|---|---|---|
| Labour | James Samson | 1,345 | 57.8% | |
| Conservative | John Heathcote | 984 | 42.2% | |
| Majority | 361 | 15.5% | ||
| Turnout | 2,329 | 59.5% | ||
| Labour hold | ||||
St Michaels[edit]
Wigton[edit]
Barrow-in-Furness[edit]
Dalton North[edit]
| Party | Candidate | Votes | % | |
|---|---|---|---|---|
| Labour | Peter Phizacklea | 1,495 | 54.5% | |
| Conservative | William James Crosthwaite | 1,246 | 45.5% | |
| Majority | 249 | 9.1% | ||
| Turnout | 2,741 | 58.1% | ||
| Labour hold | ||||
Dalton South[edit]
Hawcoat[edit]
Hindpool[edit]
Newbarns[edit]
Old Barrow[edit]
Ormsgill[edit]
Parkside[edit]
Risedale[edit]
Roosecote[edit]
Walney North[edit]
Walney South[edit]
Carlisle[edit]
Belah[edit]
Belle Vue[edit]
Botcherby[edit]
Brampton & Gilsland[edit]
Castle[edit]
Currock[edit]
Dalston & Cummersdale[edit]
Denton Holme[edit]
Harraby[edit]
Longtown & Bewcastle[edit]
Morton[edit]
St Aidans[edit]
Stanwix & Irthington[edit]
Stanwix Urban[edit]
Upperby[edit]
Wetheral[edit]
Yewdale[edit]
Copeland[edit]
Bransty[edit]
Cleator Moor North and Frizington[edit]
| Party | Candidate | Votes | % | |
|---|---|---|---|---|
| Labour | Timothy Knowles | 2,082 | 71.4% | |
| Conservative | Alexander Carroll | 834 | 28.6% | |
| Majority | 1,248 | 42.8% | ||
| Turnout | 2,916 | 55.0% | ||
| Labour hold | ||||
Cleator Moor South & Egremont[edit]
| Party | Candidate | Votes | % | |
|---|---|---|---|---|
| Labour | Simon Leyton | 1,990 | 63.9% | |
| Conservative | Jean Lewthwaite | 1,126 | 36.1% | |
| Majority | 864 | %27.7% | ||
| Turnout | 3,116 | 59.8% | ||
| Labour hold | ||||
Distington & Moresby[edit]
Gosforth & Ennerdale[edit]
Hensingham & Arlecdon[edit]
Hillcrest[edit]
Kells and Sandwith[edit]
Millom[edit]
Mirehouse[edit]
Seascale & Whicham[edit]
St Bees & Egremont[edit]
Eden[edit]
Alston and East Fellside[edit]
Appleby[edit]
Eden Lakes[edit]
Greystoke and Hesket[edit]
Kirkby Stephen[edit]
Penrith East[edit]
Penrith North[edit]
Penrith Rural[edit]
Penrith West[edit]
South Lakeland[edit]
Cartmel[edit]
Grange[edit]
High Furness[edit]
Kendal Castle[edit]
Kendal Highgate[edit]
Kendal Nether[edit]
Kendal South[edit]
Kendal Strickland and Fell[edit]
Kent Estuary[edit]
Lakes[edit]
Low Furness[edit]
Lower Kentdale[edit]
Lyth Valley[edit]
Sedbergh and Kirkby Lonsdale[edit]
Ulverston East[edit]
Ulverston West[edit]
Upper Kent[edit]
Windermere[edit]
References[edit]
- ^ a b
“Local Election Summaries 2005”. The Elections Centre. Retrieved 19 October 2019.
- ^ a b Andrew Teale. “Local Election Results 2005 – Cumbria”. Local Elections Archive Project. Retrieved 19 October 2019.
- ^ a b c d e f g h i j k l m n o p q r s t u v w x y z aa ab ac ad ae af ag ah ai aj ak al am an ao ap aq ar as at au av aw ax ay az ba bb bc bd be bf bg bh bi bj bk bl bm bn bo bp bq br bs bt bu bv bw bx by bz ca cb cc cd ce cf “Election 2005”. Cumbria County Council. Archived from the original on 30 December 2005.
- ^ a b c d e f g h i j k l m n o p q r s t u v w x y z aa ab ac ad ae af ag ah ai aj ak al am an ao ap aq ar as at au av aw ax ay az ba bb bc bd be bf bg bh bi bj bk bl bm bn bo bp bq br bs bt bu bv bw bx by bz ca cb cc cd ce cf “Cumbria County Council Election Results 1973-2009” (PDF). Elections Centre. Retrieved 18 October 2019.
Recent Comments