2012 Punjab Legislative Assembly election
From Wikipedia, the free encyclopedia
| Turnout | 78.30% ( |
|---|---|
 |
|
|
|
|
The Punjab legislative assembly election, 2012 was held on 30 January 2012, to elect 117 members to the Punjab Legislative Assembly. The results of the election were announced on 6 March 2012.[1] The ruling Shiromani Akali Dal – Bharatiya Janata Party alliance led by Parkash Singh Badal won the elections.
Background[edit]
Punjab have tradition of transfer of power every 5 years between Shiromani Akali Dal and Indian National Congress but this election of 2012 is different from others where ruling party again came to power
2012 Assembly Elections in Punjab received attention for being the first elections after reorganisation of Punjab in 1966 to witness the return of an incumbent party.
This elections also saw the emergence of new political leadership, like rise of Sukhbir Singh Badal and the rise and fall of Manpreet Singh Badal, the founder of the Peoples Party of Punjab.
Religion and Caste Data[edit]
Religion Data
As per the 2011 census,[1]
Population by faith in Punjab, India (2011)
Others and non – religious (0.60%)
Caste Data
- Dalits (Scheduled Castes) constitute 31.94% of the population, the highest percentage amongst all the states.
- Other Backward Classes (OBCs) like -Sainis, Sunar, Kambojs, Tarkhans/Ramgarhias, Gurjars, Kumhars/Prajapatis, Telis, Banjaras, Lohars constitute 31.3% of the population.
- Jat-Sikhs comprise 21% of the population while other forward castes (general category) – Brahmins, Khatris/Bhapas, Bania, Thakurs/Rajputs constitute around rest.
- As of 2016, Government of India has not publicly released Socio Economic and Caste Census 2011 caste population data for every single non-SC/ST castes (General castes, OBC/EBCs) in India.
| Caste Population data of Punjab [2] | ||
|---|---|---|
| Constitutional categories | Population (%) | Castes |
| Other Backward Classes (OBC) | 31.3% | includes Sikh Rajputs, Saini (Sainis added to OBC list in 2016), Sunar, Kamboj, Labana, Tarkhan/Ramgarhia, Kumhar/Prajapati, Arain, Gurjar, Teli, Banjara, Lohar, Bhat, Others |
| Scheduled Castes (Dalits) | 31.9% | includes Mazhabi Sikh – 10%, Ramdasia Sikh/Ravidassia (Chamar)/Ad-Dharmi – 13.1%, Balmiki/Bhanghi – 3.5%, Bazigar – 1.05%, Others – 4%[2] |
| Unreserved (mostly Upper castes) | 33% | includes Jat Sikh – 21%, (Brahmin, Rajput, Bania, Khatri-Arora-Sood) – 12% |
| Others (religious minorities) | 3.8% | includes Muslims, Christians, Buddhists, Jains |
Caste Category
Others (3.8%)
Timeline of events[edit]
Schedule for General Election to the Legislative Assembly of Punjab 2012 [3]
| S.No. | Event | Date | Day |
|---|---|---|---|
| 1. | Date for Nominations | 05.01.2012 | Thursday |
| 2. | Last Date for filing Nominations | 12.01.2012 | Thursday |
| 3. | Date for scrutiny of nominations | 13.01.2012 | Friday |
| 4. | Last date for withdrawal of candidatures | 16.01.2012 | Monday |
| 5. | Date of poll | 30.01.2012 | Monday |
| 6. | Date of counting | 04.03.2012 | Sunday |
| 7. | Date before which the election shall be completed | 09.03.2012 | Friday |
Voter Turnout[edit]
| egions/Districts | Total Seats | Turnout (%) | Congress | SAD+BJP | BSP | Independents | Others | |||
|---|---|---|---|---|---|---|---|---|---|---|
| Won | Vote (%) | Won | Vote (%) | Won | Vote (%) | Won | Vote (%) | |||
| MAJHA | ||||||||||
| Majha | 25 | 75.0 | 9 | 41.2 | 16 | 47.2 | 0 | 1.2 | 0 | 1.1 |
| Gurdaspur | 10 | 76.3 | 5 | 42.7 | 5 | 45.8 | 0 | 0.9 | 0 | 1.4 |
| Amritsar | 11 | 71.8 | 3 | 38.5 | 8 | 48.9 | 0 | 0.9 | 0 | 1.0 |
| Tarn Taran | 4 | 79.6 | 1 | 43.9 | 3 | 46.6 | 0 | 2.6 | 0 | 0.9 |
| DOABA | ||||||||||
| Doaba | 23 | 76.4 | 6 | 37.1 | 16 | 41.3 | 0 | 4.0 | 0 | 12.1 |
| Kapurthala | 4 | 79.0 | 2 | 43.4 | 2 | 44.1 | 0 | 2.7 | 0 | 7.4 |
| Jalandhar | 9 | 75.6 | 0 | 37.9 | 9 | 43.2 | 0 | 3.0 | 0 | 12.7 |
| Hoshiarpur | 7 | 75.2 | 2 | 35.9 | 4 | 40.9 | 0 | 3.1 | 0 | 9.5 |
| Nawan Shahr | 3 | 79.3 | 2 | 29.6 | 1 | 32.9 | 0 | 11.0 | 0 | 21.9 |
| MALWA | ||||||||||
| Malwa | 69 | 80.6 | 31 | 40.6 | 36 | 40.3 | 0 | 6.9 | 0 | 3.0 |
| Rupnagar | 3 | 77.5 | 1 | 37.9 | 2 | 41.4 | 0 | 10.3 | 0 | 5.0 |
| SAS Nagar | 3 | 75.8 | 2 | 30.7 | 1 | 38.3 | 0 | 4.6 | 0 | 7.7 |
| Fatehgarh Sahib | 3 | 81.9 | 2 | 33.7 | 1 | 35.5 | 0 | 20.9 | 0 | 4.1 |
| Ludhiana | 14 | 76.0 | 6 | 40.7 | 6 | 39.9 | 0 | 4.6 | 0 | 3.3 |
| Moga | 4 | 80.5 | 1 | 43.2 | 3 | 45.2 | 0 | 3.8 | 0 | 1.5 |
| Ferozepur | 8 | 83.4 | 3 | 37.4 | 5 | 39.4 | 0 | 2.8 | 0 | 1.9 |
| Muktsar | 4 | 85.2 | 2 | 40.2 | 2 | 41.0 | 0 | 12.7 | 0 | 2.6 |
| Faridkot | 3 | 84.1 | 1 | 38.8 | 2 | 43.2 | 0 | 7.1 | 0 | 2.3 |
| Bathinda | 6 | 82.6 | 2 | 40.9 | 4 | 42.0 | 0 | 9.7 | 0 | 1.6 |
| Mansa | 3 | 84.4 | 1 | 38.4 | 2 | 39.6 | 0 | 8.7 | 0 | 2.6 |
| Sangrur | 7 | 84.5 | 2 | 40.4 | 5 | 41.5 | 0 | 10.9 | 0 | 2.9 |
| Barnala | 3 | 81.8 | 3 | 45.9 | 0 | 40.1 | 0 | 4.1 | 0 | 4.0 |
| Patiala | 8 | 78.5 | 5 | 49.9 | 3 | 37.6 | 0 | 3.1 | 0 | 2.8 |
| Total | 117 | 78.6 | 46 | 40.1 | 68 | 41.9 | 0 | 5.2 | 0 | 4.3 |
| “Others” in this | ||||||||||
Parties and Alliances[edit]
National Democratic Alliance[edit]
United Progressive Alliance[edit]
Sanjha Morcha[edit]
Bahujan Samaj Party
| No. | Party | Flag | Symbol | Photo | Leader | Seats contested |
|---|---|---|---|---|---|---|
| 1. | Bahujan Samaj Party | 
|
Jasbir Singh Garhi | 117 |
Others [5][edit]
Opinion Polls[edit]
Most of the opinion polls predicted that Congress will win the election. They were proved wrong as Congress finished as the runner up.[3]
Exit Polls[edit]
2012 exit polls for Punjab Assembly Elections results.[4]
Results[edit]
Party-wise Results[edit]
| Parties and coalitions | Popular vote | Seats | ||||||
|---|---|---|---|---|---|---|---|---|
| Votes | % | ±pp | Contested | Won | +/− | |||
| Shiromani Akali Dal (SAD) | 4,828,612 | 34.73 | 94 | 56 | ||||
| Indian National Congress (INC) | 5,572,643 | 40.09 | 117 | 46 | ||||
| Bharatiya Janata Party (BJP) | 998,098 | 7.18 | 23 | 12 | ||||
| Independents (IND) | 938,770 | 6.75 | 418 | 3 | ||||
| Total | 13,901,424 | 100.00 | 117 | |||||
| Valid votes | 13,901,424 | 99.94 | ||||||
| Invalid votes | 8,149 | 0.06 | ||||||
| Votes cast / turnout | 13,909,573 | 78.30 | ||||||
| Abstentions | 3,855,182 | 21.70 | ||||||
| Registered voters | 17,764,755 | |||||||
Result by region[edit]
| Region | Seats | INC | SAD | BJP | Others |
|---|---|---|---|---|---|
| Malwa | 69 | 31 | 34 | 2 | 2 |
| Majha | 25 | 9 | 11 | 5 | 0 |
| Doaba | 23 | 6 | 11 | 5 | 1 |
| Sum | 117 | 46 | 56 | 12 | 3 |
Among parties:
| Regions | Total seats | Turnout (%) | Congress | SAD+BJP | ||
| Won | Votes (%) | Won | Votes (%) | |||
| Majha | 25 | 75.0 | 9 | 41.2 | 16 | 47.2 |
| Doaba | 23 | 76.4 | 6 | 37.1 | 16 | 41.3 |
| Malwa | 69 | 80.6 | 31 | 40.6 | 36 | 40.3 |
| Total | 117 | 78.6 | 46 | 40.1 | 68 | 41.9 |
Result by district[edit]
| District | Seats | INC | SAD | BJP | Others |
|---|---|---|---|---|---|
| Amritsar | 11 | 3 | 6 | 2 | 0 |
| Gurdaspur | 10 | 5 | 5 | 0 | 0 |
| Pathankot | 3 | 0 | 0 | 3 | 0 |
| Tarn Taran | 4 | 1 | 3 | 0 | 0 |
| Jalandhar | 9 | 0 | 6 | 3 | 0 |
| Hoshiarpur | 7 | 2 | 3 | 1 | 1 |
| Kapurthala | 4 | 2 | 1 | 1 | 0 |
| Nawanshahr | 3 | 2 | 1 | 0 | 0 |
| Ludhiana | 14 | 6 | 6 | 0 | 2 |
| Patiala | 8 | 5 | 3 | 0 | 0 |
| Sangrur | 7 | 2 | 5 | 0 | 0 |
| Bathinda | 6 | 2 | 4 | 0 | 0 |
| Firozpur | 8 | 3 | 4 | 1 | 0 |
| Moga | 4 | 1 | 3 | 0 | 0 |
| Sri Muktsar Sahib | 4 | 2 | 2 | 0 | 0 |
| Barnala | 3 | 3 | 0 | 0 | 0 |
| Faridkot | 3 | 1 | 2 | 0 | 0 |
| Fatehgarh Sahib | 3 | 2 | 1 | 0 | 0 |
| Mansa | 3 | 1 | 2 | 0 | 0 |
| Rup Nagar | 3 | 1 | 1 | 1 | 0 |
| S.A.S. Nagar | 3 | 2 | 1 | 0 | 0 |
| Sum | 117 | 46 | 56 | 12 | 3 |
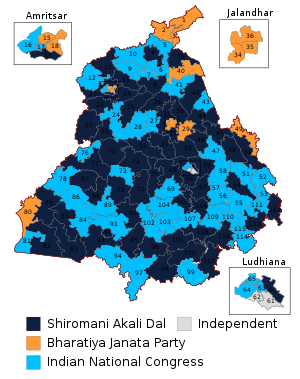
Result by constituency[edit]
By-polls 2012-2017[edit]
| A. C. NO. | Assembly Constituency Name | Category | Winner Candidates Name | Gender | Party | Vote | Runner-up Candidates Name | Gender | Party | Vote |
|---|---|---|---|---|---|---|---|---|---|---|
| By-polls in 2012 | Dasuya | GEN | Sukhjit Kaur | M | BJP | 77494 | Arun Dogra | M | INC | 30063 |
| By-Polls in 2013 | Moga | GEN | Joginder Pal Jain | M | SAD | 69269 | Sathi Vijay Kumar | M | INC | 50420 |
See also[edit]
References[edit]
External links[edit]
5. https://eci.gov.in/files/file/3455-punjab-2012/
Recent Comments