2011 Stevenage Borough Council election
before-content-x4
From Wikipedia, the free encyclopedia
Elections to Stevenage Council were held on 5 May 2011. One third of the council stood for election; the seats which were last contested in 2007. There were no changes from 2007.
After the election, the composition of the council remained as:
Election result[edit]
| Party | Seats | Gains | Losses | Net gain/loss | Seats % | Votes % | Votes | +/− | |
|---|---|---|---|---|---|---|---|---|---|
| Labour | 11 | 0 | 0 | 0 | 84.6 | 46.8 | 12,015 | +10.9 | |
| Conservative | 1 | 0 | 0 | 0 | 7.7 | 31.2 | 8,011 | -3.7 | |
| Liberal Democrats | 1 | 0 | 0 | 0 | 7.7 | 10.3 | 2,649 | -11.6 | |
| UKIP | 0 | 0 | 0 | 0 | 0 | 10.0 | 2,576 | +3.7 | |
| TUSC | 0 | 0 | 0 | 0 | 0 | 1.2 | 312 | +1.2 | |
| Green | 0 | 0 | 0 | 0 | 0 | 0.4 | 114 | +0.4 | |
Ward results[edit]
Bandley Hill[edit]

Location of Bandley Hill ward
| Party | Candidate | Votes | % |
±% |
|
|---|---|---|---|---|---|
| Labour | Jackie Hollywell | 919 | 47.3 | +8.7 | |
| Conservative | Sharon Hearn | 642 | 33.0 | -2.5 | |
| UKIP | Angela Denness | 203 | 10.4 | +1.2 | |
| Liberal Democrats | Barbara Segadelli | 118 | 6.1 | -10.5 | |
| TUSC | Mark Pickersgill | 61 | 3.1 | +3.1 | |
| Majority | 277 | 14.3 | +11.2 | ||
| Turnout | 1,943 | 39.9 | -21.6 | ||
| Labour hold | Swing | ||||
Bedwell[edit]

| Party | Candidate | Votes | % | ±% | |
|---|---|---|---|---|---|
| Labour | Liz Harrington | 1,107 | 56.7 | +16.9 | |
| Conservative | Ellin Joseph | 421 | 21.6 | -5.0 | |
| UKIP | Sean Howlett | 258 | 13.2 | -1.8 | |
| Green | Ian Cropton | 114 | 5.8 | +5.8 | |
| TUSC | Steve Glennon | 53 | 2.7 | +2.7 | |
| Majority | 686 | 35.1 | +21.9 | ||
| Turnout | 1,953 | 39.8 | -20.2 | ||
| Labour hold | Swing | ||||
Chells[edit]

Longmeadow[edit]

Location of Longmeadow ward
Manor[edit]
Martins Wood[edit]

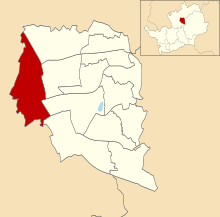
Location of Martins Wood ward
Old Town[edit]

Location of Old Town ward
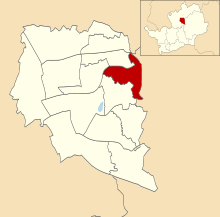
Pin Green[edit]

Location of Pin Green ward
Roebuck[edit]

| Party | Candidate | Votes | % | ±% | |
|---|---|---|---|---|---|
| Labour | John Gardner | 915 | 48.9 | +11.7 | |
| Conservative | Harvey Page | 618 | 33.1 | -0.1 | |
| UKIP | Roy Worden | 274 | 14.7 | +4.4 | |
| TUSC | Bryan Clare | 61 | 3.3 | +3.3 | |
| Majority | 297 | 15.9 | +11.9 | ||
| Turnout | 1,868 | 40.1 | -21.9 | ||
| Labour hold | Swing | ||||
Shephall[edit]

Location of Shephall ward
St Nicholas[edit]

Location of St Nicholas ward
Symonds Green[edit]
Location of Symonds Green ward
Woodfield[edit]

Location of Woodfield ward
References[edit]
after-content-x4
Recent Comments