2002 Victorian state election – Wikipedia
From Wikipedia, the free encyclopedia
  |
|
|
|
The 2002 Victorian state election, held on Saturday, 30 November 2002, was for the 55th Parliament of Victoria. It was held to elect the 88 members of Victorian Legislative Assembly and 22 members of the 44-member Legislative Council.
The Labor government led by Premier Steve Bracks was returned for a second term in a landslide victory, taking 62 seats, a gain of 20. It was easily the biggest majority that Labor had ever won in Victoria, and one of Labor’s best-ever performances at the state level in Australia. Additionally, it was only the third time that a Labor government had been reelected in Victoria. Labor also recorded 57.8 percent of the two-party preferred vote, their highest on record for a Victorian election.
Jeff Kennett had resigned as Liberal leader soon after his shock defeat in 1999, and was succeeded by former Health Minister Denis Napthine. However, Napthine was unable to get the better of Bracks, and was ousted in August 2002 by Shadow Health Minister Robert Doyle. With just a few months before the writs were dropped, Doyle was unable to recover any significant ground. The Liberals saw their seat tally more than halved, to 17 seats — their worst result since the 1952 election.
Labor also won a majority of seats in the Legislative Council for the first time in its history and secured the largest majority government in Victorian history. The Nationals (who after breaking off their Coalition with the Liberals renamed themselves the ‘VicNats’) retained the seven seats they held from 1999.
Labor was assisted by a strong economy and by the popularity of Steve Bracks, while the Liberal Party was badly divided between the Kroger and Kennett factions. The Liberal campaign was also damaged by the revelation that the shadow treasurer, Robert Dean, was ineligible to run. Dean’s electorate of Berwick had been abolished and merged into the new electorate of Gembrook. Dean won Liberal preselection for Gembrook, but failed to update his address after moving to his new electorate. As a result, he was no longer on the electoral roll; Victorian law requires candidates to be registered voters. Treasurer John Brumby loudly wondered if the Liberals could be trusted to manage Victoria’s economy if their shadow treasurer could not manage his own affairs.
This was the last Victorian election where the Legislative Council was elected using preferential voting in single-member districts (while each province has two members, they were elected at alternate elections). The Constitution (Parliamentary Reform) Act 2003 abolished the electoral provinces and divided Victoria into eight regions each electing five members using proportional representation, with all seats being vacated each election.[1]
Results[edit]
Legislative Assembly[edit]
|
Victorian state election, 30 November 2002[2] |
||||||
|---|---|---|---|---|---|---|
| Enrolled voters | 3,228,466 | |||||
| Votes cast | 3,007,342 | Turnout | 93.16 | –1.05 | ||
| Informal votes | 102,791 | Informal | 3.42 | +0.84 | ||
| Summary of votes by party | ||||||
| Party | Primary votes | % | Swing | Seats | Change | |
| Labor | 1,392,704 | 47.95 | +2.38 | 62 | +20 | |
| Liberal | 985,011 | 33.91 | –8.31 | 17 | –19 | |
| Greens | 282,585 | 9.73 | +8.58 | 0 | ± 0 | |
| National | 125,003 | 4.30 | –0.50 | 7 | ± 0 | |
| Citizens Electoral Council | 9,654 | 0.33 | +0.33 | 0 | ± 0 | |
| Democrats | 3,948 | 0.14 | –0.14 | 0 | ± 0 | |
| Socialist Alliance | 3,274 | 0.11 | +0.04 | 0 | ± 0 | |
| Christian Democrats | 1,723 | 0.06 | +0.04 | 0 | ± 0 | |
| Democratic Labor | 1,035 | 0.04 | –0.18 | 0 | ± 0 | |
| Hope | 914 | 0.03 | –0.36 | 0 | ± 0 | |
| Independent | 98,700 | 3.40 | –1.32 | 2 | – 1 | |
| Total | 2,904,551 | 88 | ||||
| Two-party-preferred | ||||||
| Labor | 1,677,856 | 57.78 | +7.58 | |||
| Liberal/National | 1,226,214 | 42.22 | –7.58 | |||
Legislative Council[edit]
The following voting statistics exclude the two mid-term by-elections held on the same day, at which one seat each was retained by the Liberal and National parties.
|
Victorian state election, 30 November 2002[3] |
||||||
|---|---|---|---|---|---|---|
| Enrolled voters | 3,228,466 | |||||
| Votes cast | 3,006,200 | Turnout | 93.12 | +0.17 | ||
| Informal votes | 110,422 | Informal | 3.67 | +0.30 | ||
| Summary of votes by party | ||||||
| Party | Primary votes | % | Swing | Seats won |
Seats held |
|
| Labor | 1,375,245 | 47.49 | +5.26 | 17 | 25 | |
| Liberal | 999,392 | 34.51 | –5.19 | 3 | 14 | |
| Greens | 314,697 | 10.87 | +8.64 | 0 | 0 | |
| National | 126,419 | 4.37 | –2.91 | 2 | 5 | |
| Democrats | 51,718 | 1.79 | –5.00 | 0 | 0 | |
| Hope | 4,615 | 0.16 | +0.16 | 0 | 0 | |
| Christian Democrats | 4,615 | 0.14 | –0.10 | 0 | 0 | |
| Independent | 19,534 | 0.67 | –0.62 | 0 | 0 | |
| Total | 2,895,778 | 22 | 44 | |||
| Two-party-preferred | ||||||
| Labor | 1,675,893 | 57.85 | +7.74 | |||
| Liberal/National | 1,220,999 | 42.15 | –7.74 | |||
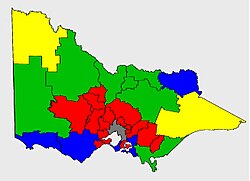
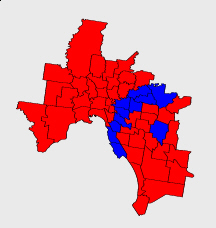
Electoral maps[edit]
|
|

|
| Metropolitan Melbourne: ALP held seats are marked in red. Liberal seats are coloured blue. | Country Victoria: ALP seats are coloured in red, Liberal in blue, Nationals in green and independents in yellow. |
Seats changing hands[edit]
- Results for Benalla are based from the 2000 by-election, which Labor won from the Nationals.
- Cranbourne became a notionally Labor seat after the redistribution.
- Members listed in italics did not recontest their seats.
See also[edit]
References[edit]
- Victorian Electoral Commission, [1]
- Costar, B.J. & Campbell J. “Realigning Victoria: The State Election of 30 November 2002”. Australian Journal of Political Science. 38 : 2: 313–323.
Recent Comments