2016 United States presidential election in Texas
Election in Texas
| Turnout | 59.4% (of registered voters) 46.5% (of voting age population)[1] |
||
|---|---|---|---|
|
|||
|
|
|||


The 2016 United States presidential election in Texas took place on November 8, 2016, as part of the 2016 United States presidential election. Primary elections were held on March 1, 2016.
Texas was won by Republican Donald Trump and his running mate Mike Pence by a 8.99% margin over Democrats Hillary Clinton and Tim Kaine. The Lone Star State assigned its 38 Electoral College votes to the state’s popular vote winner, but two faithless electors chose other candidates, making Texas the only state in 2016 to give Trump fewer than the assigned electoral votes. Even then, its 36 electoral votes were Trump’s largest electoral prize in 2016.
When the Electoral College met on December 19, 2016, only 36 out of the 38 electors voted for Trump for president. Two electors defected; one voted for Ohio Governor John Kasich, and the other voted for Congressman Ron Paul. For vice president, 37 electors voted for Pence, while one voted for Carly Fiorina. This was the first time since 1976 where a Republican presidential candidate lost a pledged vote via a faithless elector; that year, Gerald Ford lost a Washington state electoral vote to fellow Republican Ronald Reagan. Additionally, this was the first time since 1972 that the winning presidential candidate lost an electoral vote, when Richard Nixon lost a Virginia electoral vote to Libertarian Party nominee John Hospers.
Texas was one of the eleven states where Clinton improved on Barack Obama’s performance in 2012.[2] Clinton lost Texas by a smaller margin than any Democrat since 1996 (though Barack Obama got a slightly larger percentage of the vote in 2008), which analysts attributed to Trump losing ground with college-educated white voters. Trump’s performance in the Lone Star state was the weakest of any victorious Republican nominee since Richard Nixon became the last Republican to be elected president without Texas in 1968. Trump was the tenth consecutive Republican presidential nominee to win Texas, beginning with Reagan in 1980. Nevertheless, he became the first Republican to win the White House without carrying Bexar County since Richard Nixon in 1968, as well as the first to do so without carrying Fort Bend County since Herbert Hoover in 1928, and to do so without carrying Harris or Dallas County since Calvin Coolidge in 1924.
Primaries[edit]
Democratic primary[edit]
The Texas Democratic Party held their state’s primary in concurrence with the other Super Tuesday contests on March 1. Eight candidates appeared on the ballot, Hillary Clinton, Bernie Sanders, dropped-out candidate Martin O’Malley and five minor candidates (Rocky De La Fuente, Willie Wilson, Star Locke, Keith Russell Judd and Calvis Hawes.) The Texas Democratic primary had 251 delegates to the Democratic National Convention: 222 pledged delegates and 29 super delegates. 145 delegates were allocated proportionally based on the results in the state’s 31 senatorial districts. The other 77 pledged delegates were allocated proportionally based on the statewide popular vote.[3]
Results[edit]
| Candidate | Popular vote | Delegates | |||
|---|---|---|---|---|---|
| Count | Percentage | Pledged delegates | Super delegates | Total delegates | |
| 936,004 | 65.19% | 147 | 21 | 168 | |
| Bernie Sanders | 476,547 | 33.19% | 75 | 0 | 75 |
| Rocky De Le Fuente | 8,429 | 0.59% | 0 | 0 | 0 |
| Martin O’Malley | 5,364 | 0.37% | 0 | 0 | 0 |
| Willie Wilson | 3,254 | 0.23% | 0 | 0 | 0 |
| Keith Russell Judd | 2,569 | 0.18% | 0 | 0 | 0 |
| Calvis L. Hawes | 2,017 | 0.14% | 0 | 0 | 0 |
| Star Locke | 1,711 | 0.12% | 0 | 0 | 0 |
| Uncommitted | n/a | 8 | 8 | ||
| Total: | 1,435,895 | 100% | 222 | 29 | 251 |
| Key: | Withdrew prior to contest |
Republican primary[edit]
Texas results by county Ted Cruz Donald Trump |
Debates and forums[edit]
February 24, 2016 – Houston, Texas
Megyn Kelly hosted a two-hour town hall event on The Kelly File with Kasich, Cruz, Rubio, and Carson in attendance. Trump did not participate in the forum.[5]
February 25, 2016 – Houston, Texas
After the caucus in Nevada, the tenth debate was held at the University of Houston in Houston and broadcast by CNN as its third of four debates, in conjunction with Telemundo. The debate aired five days before 14 states voted on Super Tuesday, March 1. While the debate was to be held in partnership with Telemundo’s English-language counterpart NBC, RNC Chairman Reince Priebus announced on October 30, 2015, that it had suspended the partnership in response to CNBC’s “bad faith” in handling the October 28, 2015, debate.[8][9] On January 18, 2016, the RNC announced that CNN would replace NBC News as the main host of the debate, in partnership with Telemundo and Salem Communications (CNN’s conservative media partner). The debate was shifted a day earlier at the same time.[10]National Review was disinvited by the Republican National Committee from co-hosting the debate over its criticism of GOP front-runner Donald Trump.[11] On February 19, the criteria for invitation to the debate was announced: in addition to having official statements of candidacy with the Federal Election Commission and accepting the rules of the debate, candidates must have received at least 5% support in one of the first four election contests held in Iowa, New Hampshire, South Carolina, and Nevada.[12] By these criteria, all five remaining candidates, Carson, Cruz, Kasich, Rubio, and Trump, qualified for invitation to the debate. The 155 delegates to the Republican National Convention were allocated in this way. 108 delegates are allocated by congressional district; 3 per district. If a candidate gets over 50% of the vote in a congressional district; they would win all of the district’s 3 delegates. If no one had a majority and one candidate had at least 20% of the vote, the candidate winning the plurality would get 2 delegates and the candidate in second place would get 1 delegate. If nobody receives at least 20% of the vote, the top 3 vote-getters each get 1 delegate. There were another 47 at-large delegates. If someone received more than 50% of the vote, they would get all of the at-large delegates. If no one got more than 50% of the vote and there were at least 2 candidates that got over 20% of the vote, the delegates would be allocated proportionally among the candidates receiving more than 20% of the vote. If only one candidate got over 20% of the vote and not a majority, the delegates would be allocated between the candidate that got over 20% of the vote and the candidate who received the 2nd most votes. If no candidate got 20%, they would allocate all of the 47 at-large delegates proportionally.[13]
Results[edit]
| Candidate | Popular vote | Delegates | |
|---|---|---|---|
| Count | Percentage | ||
| 1,241,118 | 43.76% | 104 | |
| Donald Trump | 758,762 | 26.75% | 48 |
| Marco Rubio | 503,055 | 17.74% | 3 |
| John Kasich | 120,473 | 4.25% | 0 |
| Ben Carson | 117,969 | 4.16% | 0 |
| Jeb Bush | 35,420 | 1.25% | 0 |
| Uncommitted | 29,609 | 1.04% | 0 |
| Rand Paul | 8,000 | 0.28% | 0 |
| Mike Huckabee | 6,226 | 0.22% | 0 |
| Elizabeth Gray | 5,449 | 0.19% | 0 |
| Chris Christie | 3,448 | 0.12% | 0 |
| Carly Fiorina | 3,247 | 0.11% | 0 |
| Rick Santorum | 2,006 | 0.07% | 0 |
| Lindsey Graham | 1,706 | 0.06% | 0 |
| Total: | 2,836,488 | 100% | 155 |
| Key: | Withdrew prior to contest |
Green Party convention[edit]
The Texas Green Party held its party caucuses at conventions at the precinct level on March 8,[15] the county level on March 12,[16] and the district level on March 19,[17] leading up to the state nominating convention in Grey Forest, Texas, on April 9 and 10.[18]
On April 10 it was announced that Jill Stein had won the state convention.[19]
| Candidate | Votes | Percentage | National delegates |
|---|---|---|---|
| – | – | 15 | |
| Sedinam Moyowasifza-Curry | – | – | 3 |
| Darryl Cherney | – | – | 2 |
| Kent Mesplay | – | – | 2 |
| William Kreml | – | – | 1 |
| Total | – | 100.00% | 23 |
General election[edit]
Polling[edit]
Trump won every single pre-election poll with margins varying from 2 to 14 points. Trump won the last poll 49% to 35% and the average of the last three polls showed Trump leading 50% to 38%.[20]
Predictions[edit]
The following are final 2016 predictions from various organizations for Texas as of Election Day.
Results[edit]
The voting age population was 19,307,355, of which 15,101,087 were registered to vote. Turnout was 8,969,226, which is 46.45% of the voting age population and 59.39% of registered voters. The early voting period lasted for two weeks ending November 4, with 43.5% of registered voters casting early or absentee ballots. Out of those who cast votes, 73% cast their ballots early or absentee and 26% voted on Election Day.[30]
Thirteen candidates received write-in votes, of which the large majority (42,366) went to Evan McMullin.

-
>50%
-
40-50%
-
30-40%
-
20-30%
-
15-20%
-
10-15%
-
5-10%
-
1-5%
-
1-5%
-
5-10%
-
10-15%
-
15-20%
-
20-30%
-
30-40%
-
40-50%
-
>50%
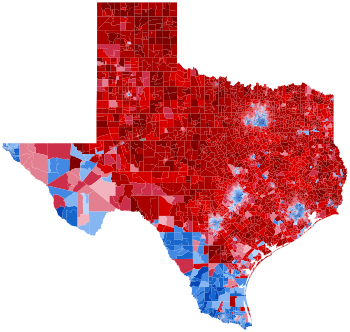
By county[edit]
| County [34] | Hillary R. Clinton | Donald J. Trump | Gary E. Johnson | Jill E. Stein | Others | Margin | Total | ||||||
|---|---|---|---|---|---|---|---|---|---|---|---|---|---|
| # | % | # | % | # | % | # | % | # | % | # | % | ||
| Anderson | 3,369 | 19.84% | 13,201 | 77.76% | 308 | 1.81% | 57 | 0.34% | 42 | 0.25% | 9,832 | 57.91% | 16,977 |
| Andrews | 836 | 16.91% | 3,927 | 79.45% | 147 | 2.97% | 18 | 0.36% | 15 | 0.30% | 3,091 | 62.53% | 4,943 |
| Angelina | 7,538 | 25.20% | 21,668 | 72.44% | 560 | 1.87% | 106 | 0.35% | 39 | 0.13% | 14,130 | 47.24% | 29,911 |
| Aransas | 2,465 | 23.45% | 7,740 | 73.63% | 238 | 2.26% | 41 | 0.39% | 28 | 0.27% | 5,275 | 50.18% | 10,512 |
| Archer | 394 | 9.20% | 3,786 | 88.40% | 80 | 1.87% | 10 | 0.23% | 13 | 0.30% | 3,392 | 79.20% | 4,283 |
| Armstrong | 70 | 6.86% | 924 | 90.50% | 18 | 1.76% | 5 | 0.49% | 4 | 0.39% | 854 | 83.64% | 1,021 |
| Atascosa | 4,651 | 34.02% | 8,618 | 63.03% | 308 | 2.25% | 65 | 0.48% | 31 | 0.23% | 3,967 | 29.01% | 13,673 |
| Austin | 2,320 | 18.90% | 9,637 | 78.52% | 248 | 2.02% | 51 | 0.42% | 18 | 0.15% | 7,317 | 59.61% | 12,274 |
| Bailey | 397 | 22.14% | 1,344 | 74.96% | 39 | 2.18% | 5 | 0.28% | 8 | 0.45% | 947 | 52.82% | 1,793 |
| Bandera | 1,726 | 16.89% | 8,163 | 79.89% | 262 | 2.56% | 66 | 0.65% | 1 | 0.01% | 6,437 | 63.00% | 10,218 |
| Bastrop | 10,569 | 37.14% | 16,328 | 57.38% | 1,063 | 3.74% | 320 | 1.12% | 174 | 0.61% | 5,759 | 20.24% | 28,454 |
| Baylor | 191 | 12.74% | 1,267 | 84.52% | 31 | 2.07% | 3 | 0.20% | 7 | 0.47% | 1,076 | 71.78% | 1,499 |
| Bee | 3,444 | 40.59% | 4,744 | 55.91% | 238 | 2.80% | 34 | 0.40% | 25 | 0.29% | 1,300 | 15.32% | 8,485 |
| Bell | 37,801 | 39.79% | 51,998 | 54.74% | 3,824 | 4.03% | 812 | 0.85% | 559 | 0.59% | 14,197 | 14.95% | 94,994 |
| Bexar | 319,550 | 54.19% | 240,333 | 40.76% | 20,091 | 3.41% | 6,645 | 1.13% | 3,026 | 0.51% | -79,217 | -13.43% | 589,645 |
| Blanco | 1,244 | 21.88% | 4,212 | 74.09% | 180 | 3.17% | 33 | 0.58% | 16 | 0.28% | 2,968 | 52.21% | 5,685 |
| Borden | 31 | 8.49% | 330 | 90.41% | 3 | 0.82% | 1 | 0.27% | 0 | 0.00% | 299 | 81.92% | 365 |
| Bosque | 1,278 | 16.31% | 6,339 | 80.88% | 155 | 1.98% | 40 | 0.51% | 26 | 0.33% | 4,161 | 47.62% | 7,838 |
| Bowie | 8,838 | 25.54% | 24,924 | 72.03% | 582 | 1.68% | 145 | 0.42% | 113 | 0.33% | 16,086 | 46.49% | 34,602 |
| Brazoria | 43,200 | 35.65% | 72,791 | 60.07% | 3,768 | 3.11% | 806 | 0.67% | 616 | 0.51% | 29,591 | 24.42% | 121,181 |
| Brazos | 23,121 | 34.40% | 38,738 | 57.64% | 3,813 | 5.67% | 536 | 0.80% | 1,003 | 1.49% | 15,617 | 23.24% | 67,211 |
| Brewster | 1,873 | 44.05% | 2,077 | 48.85% | 210 | 4.94% | 77 | 1.81% | 15 | 0.35% | 204 | 4.80% | 4,252 |
| Briscoe | 91 | 12.36% | 625 | 84.92% | 14 | 1.90% | 4 | 0.54% | 2 | 0.27% | 534 | 72.55% | 736 |
| Brooks | 1,937 | 74.61% | 613 | 23.61% | 32 | 1.23% | 14 | 0.54% | 0 | 0.00% | -1,324 | -51.00% | 2,596 |
| Brown | 1,621 | 11.56% | 12,017 | 85.68% | 253 | 1.80% | 65 | 0.46% | 70 | 0.50% | 10,396 | 74.12% | 14,026 |
| Burleson | 1,491 | 21.42% | 5,316 | 76.38% | 118 | 1.70% | 20 | 0.29% | 15 | 0.22% | 3,825 | 54.96% | 6,960 |
| Burnet | 3,797 | 19.77% | 14,638 | 76.22% | 564 | 2.94% | 104 | 0.54% | 101 | 0.53% | 10,841 | 56.45% | 19,204 |
| Caldwell | 4,795 | 39.65% | 6,691 | 55.33% | 446 | 3.69% | 105 | 0.87% | 55 | 0.45% | 1,896 | 15.68% | 12,092 |
| Calhoun | 2,118 | 30.41% | 4,638 | 66.59% | 168 | 2.41% | 33 | 0.47% | 8 | 0.11% | 2,520 | 36.18% | 6,965 |
| Callahan | 569 | 10.20% | 4,865 | 87.20% | 107 | 1.92% | 23 | 0.41% | 15 | 0.27% | 4,296 | 77.00% | 5,579 |
| Cameron | 59,402 | 64.51% | 29,472 | 32.01% | 2,236 | 2.43% | 822 | 0.89% | 147 | 0.16% | -29,930 | -32.50% | 92,079 |
| Camp | 1,260 | 27.74% | 3,201 | 70.48% | 66 | 1.45% | 15 | 0.33% | 0 | 0.00% | 1,941 | 42.73% | 4,542 |
| Carson | 249 | 8.40% | 2,620 | 88.39% | 68 | 2.29% | 11 | 0.37% | 16 | 0.54% | 2,371 | 80.00% | 2,964 |
| Cass | 2,391 | 19.37% | 9,726 | 78.79% | 145 | 1.17% | 34 | 0.28% | 48 | 0.39% | 7,335 | 59.42% | 12,344 |
| Castro | 526 | 26.34% | 1,414 | 70.81% | 47 | 2.35% | 10 | 0.50% | 0 | 0.00% | 888 | 44.47% | 1,997 |
| Chambers | 2,948 | 17.56% | 13,339 | 79.47% | 385 | 2.29% | 59 | 0.35% | 55 | 0.33% | 10391 | 61.91% | 16,786 |
| Cherokee | 3,469 | 20.66% | 12,919 | 76.94% | 305 | 1.82% | 34 | 0.20% | 63 | 0.38% | 9450 | 56.28% | 16,790 |
| Childress | 253 | 12.14% | 1,802 | 86.47% | 24 | 1.15% | 5 | 0.24% | 0 | 0.00% | 1,549 | 74.33% | 2,084 |
| Clay | 536 | 10.68% | 4,377 | 87.23% | 87 | 1.73% | 12 | 0.24% | 6 | 0.12% | 3,841 | 76.55% | 5,018 |
| Cochran | 190 | 21.09% | 679 | 75.36% | 29 | 3.22% | 3 | 0.33% | 0 | 0.00% | 489 | 54.27% | 901 |
| Coke | 140 | 9.84% | 1,265 | 88.90% | 16 | 1.12% | 2 | 0.14% | 0 | 0.00% | 1,125 | 79.06% | 1,423 |
| Coleman | 388 | 10.65% | 3,177 | 87.21% | 53 | 1.45% | 18 | 0.49% | 7 | 0.19% | 2,789 | 76.56% | 3,643 |
| Collin | 140,624 | 38.91% | 201,014 | 55.62% | 13,855 | 3.83% | 2,539 | 0.70% | 3,387 | 0.94% | 60,390 | 16.71% | 361,419 |
| Collingsworth | 145 | 12.54% | 983 | 85.03% | 22 | 1.90% | 4 | 0.35% | 2 | 0.17% | 838 | 72.49% | 1,156 |
| Colorado | 1,987 | 23.34% | 6,325 | 74.30% | 144 | 1.69% | 37 | 0.43% | 20 | 0.23% | 4,338 | 50.96% | 8,513 |
| Comal | 14,238 | 22.90% | 45,136 | 72.59% | 2,068 | 3.33% | 343 | 0.55% | 393 | 0.63% | 30,898 | 49.69% | 62,178 |
| Comanche | 789 | 15.07% | 4,333 | 82.74% | 88 | 1.68% | 21 | 0.40% | 6 | 0.11% | 3,544 | 67.67% | 5,237 |
| Concho | 148 | 13.86% | 885 | 82.87% | 27 | 2.53% | 7 | 0.66% | 1 | 0.09% | 737 | 69.01% | 1,068 |
| Cooke | 2,352 | 14.74% | 13,181 | 82.61% | 317 | 1.99% | 60 | 0.38% | 45 | 0.28% | 10,829 | 67.87% | 15,955 |
| Coryell | 5,064 | 27.74% | 12,225 | 66.98% | 704 | 3.86% | 161 | 0.88% | 99 | 0.54% | 7,161 | 39.23% | 18,253 |
| Cottle | 92 | 15.03% | 506 | 82.68% | 12 | 1.96% | 2 | 0.33% | 0 | 0.00% | 414 | 67.65% | 612 |
| Crane | 299 | 21.60% | 1,049 | 75.79% | 28 | 2.02% | 7 | 0.51% | 1 | 0.07% | 750 | 54.19% | 1,384 |
| Crockett | 372 | 26.67% | 980 | 70.25% | 39 | 2.80% | 4 | 0.29% | 0 | 0.00% | 608 | 43.58% | 1,395 |
| Crosby | 468 | 27.08% | 1,181 | 68.34% | 60 | 3.47% | 5 | 0.29% | 14 | 0.81% | 713 | 41.26% | 1,728 |
| Culberson | 454 | 59.19% | 280 | 36.51% | 23 | 3.00% | 6 | 0.78% | 4 | 0.52% | -174 | -22.68% | 767 |
| Dallam | 222 | 14.38% | 1,261 | 81.67% | 46 | 2.98% | 9 | 0.58% | 6 | 0.39% | 1,544 | ||
| Dallas | 461,080 | 60.75% | 262,945 | 34.64% | 24,025 | 3.17% | 6,114 | 0.81% | 4,809 | 0.63% | 758,973 | ||
| Dawson | 835 | 23.44% | 2,636 | 73.98% | 80 | 2.25% | 11 | 0.31% | 1 | 0.03% | 3,563 | ||
| Deaf Smith | 1,185 | 28.11% | 2,911 | 69.05% | 91 | 2.16% | 14 | 0.33% | 15 | 0.36% | 4,216 | ||
| Delta | 400 | 17.54% | 1,836 | 80.49% | 36 | 1.58% | 7 | 0.31% | 2 | 0.09% | 2,281 | ||
| Denton | 110,890 | 37.13% | 170,603 | 57.13% | 11,583 | 3.88% | 2,660 | 0.89% | 2,909 | 0.97% | 298,645 | ||
| Dewitt | 1,163 | 16.99% | 5,519 | 80.64% | 124 | 1.81% | 27 | 0.39% | 11 | 0.16% | 6,844 | ||
| Dickens | 128 | 14.08% | 755 | 83.06% | 23 | 2.53% | 3 | 0.33% | 0 | 0.00% | 909 | ||
| Dimmit | 2,173 | 67.38% | 974 | 30.20% | 57 | 1.77% | 21 | 0.65% | 0 | 0.00% | 3,225 | ||
| Donley | 191 | 13.04% | 1,225 | 83.62% | 40 | 2.73% | 5 | 0.34% | 4 | 0.27% | 1,465 | ||
| Duval | 2,783 | 66.77% | 1,316 | 31.57% | 49 | 1.18% | 19 | 0.46% | 1 | 0.02% | 4,168 | ||
| Eastland | 776 | 11.14% | 6,011 | 86.33% | 120 | 1.72% | 31 | 0.45% | 25 | 0.36% | 6,963 | ||
| Ector | 10,249 | 28.06% | 25,020 | 68.49% | 1,009 | 2.76% | 167 | 0.46% | 85 | 0.23% | 36,530 | ||
| Edwards | 303 | 28.24% | 746 | 69.52% | 17 | 1.58% | 5 | 0.47% | 2 | 0.19% | 1,073 | ||
| Ellis | 16,253 | 25.53% | 44,941 | 70.58% | 1,747 | 2.74% | 325 | 0.51% | 407 | 0.64% | 63,673 | ||
| El Paso | 147,843 | 69.08% | 55,512 | 25.94% | 7,607 | 3.55% | 2,945 | 1.38% | 101 | 0.05% | 214,008 | ||
| Erath | 2,160 | 15.55% | 11,210 | 80.69% | 378 | 2.72% | 68 | 0.49% | 77 | 0.55% | 13,893 | ||
| Falls | 1,684 | 32.09% | 3,441 | 65.57% | 90 | 1.71% | 23 | 0.44% | 10 | 0.19% | 5,248 | ||
| Fannin | 2,132 | 17.70% | 9,548 | 79.28% | 269 | 2.23% | 46 | 0.38% | 49 | 0.41% | 12,044 | ||
| Fayette | 2,144 | 19.19% | 8,743 | 78.24% | 209 | 1.87% | 45 | 0.40% | 33 | 0.30% | 11,174 | ||
| Fisher | 403 | 23.31% | 1,265 | 73.16% | 44 | 2.54% | 10 | 0.58% | 7 | 0.40% | 1,729 | ||
| Floyd | 435 | 22.21% | 1,474 | 75.24% | 47 | 2.40% | 3 | 0.15% | 0 | 0.00% | 1,959 | ||
| Foard | 113 | 22.03% | 383 | 74.66% | 14 | 2.73% | 1 | 0.19% | 2 | 0.39% | 513 | ||
| Fort Bend | 134,686 | 51.39% | 117,291 | 44.76% | 6,907 | 2.64% | 1,783 | 0.68% | 1,399 | 0.53% | 262,066 | ||
| Franklin | 665 | 15.18% | 3,585 | 81.85% | 96 | 2.19% | 12 | 0.27% | 22 | 0.50% | 4,380 | ||
| Freestone | 1,471 | 19.14% | 6,026 | 78.42% | 139 | 1.81% | 13 | 0.17% | 35 | 0.46% | 7,684 | ||
| Frio | 2,444 | 55.55% | 1,856 | 42.18% | 76 | 1.73% | 24 | 0.55% | 0 | 0.00% | 4,400 | ||
| Gaines | 597 | 12.92% | 3,907 | 84.57% | 85 | 1.84% | 20 | 0.43% | 11 | 0.24% | 4,620 | ||
| Galveston | 43,658 | 35.52% | 73,757 | 60.01% | 4,045 | 3.29% | 889 | 0.72% | 554 | 0.45% | 122,903 | ||
| Garza | 230 | 15.50% | 1,225 | 82.55% | 21 | 1.42% | 7 | 0.47% | 1 | 0.07% | 1,484 | ||
| Gillespie | 2,288 | 17.31% | 10,446 | 79.05% | 333 | 2.52% | 61 | 0.46% | 86 | 0.65% | 13,214 | ||
| Glasscock | 34 | 5.63% | 553 | 91.56% | 13 | 2.15% | 2 | 0.33% | 2 | 0.33% | 604 | ||
| Goliad | 973 | 26.24% | 2,620 | 70.66% | 101 | 2.72% | 10 | 0.27% | 4 | 0.11% | 3,708 | ||
| Gonzales | 1,571 | 24.80% | 4,587 | 72.42% | 129 | 2.04% | 28 | 0.44% | 19 | 0.30% | 6,334 | ||
| Gray | 701 | 9.47% | 6,500 | 87.78% | 144 | 1.94% | 22 | 0.30% | 38 | 0.51% | 7,405 | ||
| Grayson | 10,301 | 21.72% | 35,325 | 74.50% | 1,258 | 2.65% | 264 | 0.56% | 268 | 0.57% | 47,416 | ||
| Gregg | 11,677 | 27.97% | 28,764 | 68.90% | 903 | 2.16% | 150 | 0.36% | 255 | 0.61% | 41,749 | ||
| Grimes | 2,194 | 23.01% | 7,065 | 74.11% | 219 | 2.30% | 50 | 0.52% | 5 | 0.05% | 9,533 | ||
| Guadalupe | 18,391 | 31.81% | 36,632 | 63.35% | 2,022 | 3.50% | 412 | 0.71% | 365 | 0.63% | 57,822 | ||
| Hale | 2,101 | 23.72% | 6,366 | 71.87% | 324 | 3.66% | 43 | 0.49% | 24 | 0.27% | 8,858 | ||
| Hall | 164 | 15.03% | 893 | 81.85% | 34 | 3.12% | 0 | 0.00% | 0 | 0.00% | 1,091 | ||
| Hamilton | 479 | 13.23% | 3,060 | 84.53% | 64 | 1.77% | 10 | 0.28% | 7 | 0.19% | 3,620 | ||
| Hansford | 171 | 8.78% | 1,730 | 88.85% | 37 | 1.90% | 9 | 0.46% | 0 | 0.00% | 1,947 | ||
| Hardeman | 249 | 16.46% | 1,207 | 79.78% | 48 | 3.17% | 7 | 0.46% | 2 | 0.13% | 1,513 | ||
| Hardin | 2,780 | 12.20% | 19,606 | 86.07% | 353 | 1.55% | 41 | 0.18% | 0 | 0.00% | 22,780 | ||
| Harris | 707,914 | 53.95% | 545,955 | 41.61% | 39,781 | 3.03% | 11,784 | 0.90% | 6,678 | 0.51% | 1,312,112 | ||
| Harrison | 7,151 | 26.94% | 18,749 | 70.62% | 449 | 1.69% | 76 | 0.29% | 123 | 0.46% | 26,548 | ||
| Hartley | 173 | 8.86% | 1,730 | 88.63% | 43 | 2.20% | 3 | 0.15% | 3 | 0.15% | 1,952 | ||
| Haskell | 314 | 17.74% | 1,403 | 79.27% | 42 | 2.37% | 6 | 0.34% | 5 | 0.28% | 1,770 | ||
| Hays | 33,224 | 46.04% | 33,826 | 46.87% | 3,630 | 5.03% | 1,061 | 1.47% | 423 | 0.59% | 72,164 | ||
| Hemphill | 181 | 10.68% | 1,462 | 86.25% | 44 | 2.60% | 2 | 0.12% | 6 | 0.35% | 1,695 | ||
| Henderson | 5,669 | 18.87% | 23,650 | 78.72% | 535 | 1.78% | 102 | 0.34% | 89 | 0.30% | 30,045 | ||
| Hidalgo | 118,809 | 68.50% | 48,642 | 28.05% | 3,788 | 2.18% | 1,856 | 1.07% | 342 | 0.20% | 173,437 | ||
| Hill | 2,547 | 19.64% | 10,108 | 77.93% | 256 | 1.97% | 40 | 0.31% | 19 | 0.15% | 12,970 | ||
| Hockley | 1,260 | 17.23% | 5,809 | 79.46% | 199 | 2.72% | 33 | 0.45% | 10 | 0.14% | 7,311 | ||
| Hood | 4,008 | 15.26% | 21,382 | 81.42% | 641 | 2.44% | 113 | 0.43% | 118 | 0.45% | 26,262 | ||
| Hopkins | 2,510 | 18.54% | 10,707 | 79.09% | 220 | 1.63% | 44 | 0.33% | 57 | 0.42% | 13,538 | ||
| Houston | 1,978 | 23.68% | 6,205 | 74.28% | 90 | 1.08% | 29 | 0.35% | 51 | 0.61% | 8,353 | ||
| Howard | 1,770 | 20.29% | 6,637 | 76.09% | 232 | 2.66% | 56 | 0.64% | 28 | 0.32% | 8,723 | ||
| Hudspeth | 324 | 37.20% | 503 | 57.75% | 38 | 4.36% | 6 | 0.69% | 0 | 0.00% | 871 | ||
| Hunt | 6,396 | 20.27% | 23,910 | 75.77% | 862 | 2.73% | 162 | 0.51% | 224 | 0.71% | 31,554 | ||
| Hutchinson | 854 | 10.47% | 7,042 | 86.35% | 210 | 2.58% | 23 | 0.28% | 26 | 0.32% | 8,155 | ||
| Irion | 90 | 11.75% | 660 | 86.16% | 9 | 1.17% | 1 | 0.13% | 6 | 0.78% | 766 | ||
| Jack | 314 | 9.37% | 2,973 | 88.75% | 42 | 1.25% | 10 | 0.30% | 11 | 0.33% | 3,350 | ||
| Jackson | 904 | 17.05% | 4,266 | 80.46% | 78 | 1.47% | 27 | 0.51% | 27 | 0.51% | 5,302 | ||
| Jasper | 2,590 | 19.30% | 10,609 | 79.06% | 156 | 1.16% | 38 | 0.28% | 26 | 0.19% | 13,419 | ||
| Jeff Davis | 422 | 35.43% | 695 | 58.35% | 42 | 3.53% | 17 | 1.43% | 15 | 1.26% | 1,191 | ||
| Jefferson | 42,443 | 48.44% | 42,862 | 48.92% | 1,714 | 1.96% | 420 | 0.48% | 179 | 0.20% | 87,618 | ||
| Jim Hogg | 1,635 | 77.16% | 430 | 20.29% | 42 | 1.98% | 12 | 0.57% | 0 | 0.00% | 2,119 | ||
| Jim Wells | 6,694 | 54.08% | 5,420 | 43.78% | 210 | 1.70% | 40 | 0.32% | 15 | 0.12% | 12,379 | ||
| Johnson | 10,988 | 19.07% | 44,382 | 77.04% | 1,605 | 2.79% | 324 | 0.56% | 307 | 0.53% | 57,606 | ||
| Jones | 936 | 15.70% | 4,819 | 80.86% | 162 | 2.72% | 21 | 0.35% | 22 | 0.37% | 5,960 | ||
| Karnes | 1,145 | 27.27% | 2,965 | 70.63% | 70 | 1.67% | 12 | 0.29% | 6 | 0.14% | 4,198 | ||
| Kaufman | 10,278 | 24.91% | 29,587 | 71.70% | 983 | 2.38% | 197 | 0.48% | 220 | 0.53% | 41,265 | ||
| Kendall | 3,643 | 18.11% | 15,700 | 78.03% | 555 | 2.76% | 87 | 0.43% | 135 | 0.67% | 20,120 | ||
| Kenedy | 99 | 53.23% | 84 | 45.16% | 3 | 1.61% | 0 | 0.00% | 0 | 0.00% | 186 | ||
| Kent | 59 | 13.59% | 360 | 82.95% | 14 | 3.23% | 0 | 0.00% | 1 | 0.23% | 434 | ||
| Kerr | 4,681 | 20.09% | 17,727 | 76.09% | 657 | 2.82% | 116 | 0.50% | 116 | 0.50% | 23,297 | ||
| Kimble | 206 | 10.55% | 1,697 | 86.94% | 37 | 1.90% | 5 | 0.26% | 7 | 0.36% | 1,952 | ||
| King | 5 | 3.14% | 149 | 93.71% | 5 | 3.14% | 0 | 0.00% | 0 | 0.00% | 159 | ||
| Kinney | 458 | 32.03% | 936 | 65.45% | 25 | 1.75% | 6 | 0.42% | 5 | 0.35% | 1,430 | ||
| Kleberg | 4,716 | 49.58% | 4,367 | 45.91% | 314 | 3.30% | 92 | 0.97% | 23 | 0.24% | 9,512 | ||
| Knox | 247 | 18.07% | 1,078 | 78.86% | 28 | 2.05% | 5 | 0.37% | 9 | 0.66% | 1,367 | ||
| Lamar | 3,583 | 19.25% | 14,561 | 78.24% | 343 | 1.84% | 70 | 0.38% | 54 | 0.29% | 18,611 | ||
| Lamb | 771 | 19.30% | 3,111 | 77.87% | 85 | 2.13% | 8 | 0.20% | 20 | 0.50% | 3,995 | ||
| Lampasas | 1,483 | 18.07% | 6,385 | 77.82% | 253 | 3.08% | 47 | 0.57% | 37 | 0.45% | 8,205 | ||
| LaSalle | 1,129 | 54.83% | 872 | 42.35% | 44 | 2.14% | 10 | 0.49% | 4 | 0.19% | 2,059 | ||
| Lavaca | 1,170 | 13.51% | 7,347 | 84.83% | 112 | 1.29% | 12 | 0.14% | 20 | 0.23% | 8,661 | ||
| Lee | 1,372 | 20.99% | 4,997 | 76.47% | 126 | 1.93% | 28 | 0.43% | 12 | 0.18% | 6,535 | ||
| Leon | 909 | 12.22% | 6,391 | 85.91% | 94 | 1.26% | 13 | 0.17% | 32 | 0.43% | 7,439 | ||
| Liberty | 4,862 | 20.04% | 18,892 | 77.85% | 364 | 1.50% | 85 | 0.35% | 64 | 0.26% | 24,267 | ||
| Limestone | 1,778 | 22.97% | 5,796 | 74.89% | 128 | 1.65% | 27 | 0.35% | 10 | 0.13% | 7,739 | ||
| Lipscomb | 135 | 10.14% | 1,159 | 87.01% | 25 | 1.88% | 3 | 0.23% | 10 | 0.75% | 1,332 | ||
| Live Oak | 742 | 17.25% | 3,464 | 80.52% | 65 | 1.51% | 13 | 0.30% | 18 | 0.42% | 4,302 | ||
| Llano | 1,825 | 17.47% | 8,299 | 79.44% | 205 | 1.96% | 65 | 0.62% | 53 | 0.51% | 10,447 | ||
| Loving | 4 | 6.15% | 58 | 89.23% | 1 | 1.54% | 2 | 3.08% | 0 | 0.00% | 65 | ||
| Lubbock | 28,023 | 28.30% | 65,651 | 66.31% | 3,917 | 3.96% | 633 | 0.64% | 789 | 0.80% | 99,013 | ||
| Lynn | 403 | 20.06% | 1,546 | 76.95% | 41 | 2.04% | 7 | 0.35% | 12 | 0.60% | 2,009 | ||
| Madison | 881 | 20.54% | 3,351 | 78.13% | 45 | 1.05% | 8 | 0.19% | 4 | 0.09% | 4,289 | ||
| Marion | 1,165 | 27.49% | 2,983 | 70.39% | 71 | 1.68% | 13 | 0.31% | 6 | 0.14% | 4,238 | ||
| Martin | 266 | 15.10% | 1,455 | 82.58% | 31 | 1.76% | 5 | 0.28% | 5 | 0.28% | 1,762 | ||
| Mason | 354 | 17.21% | 1,656 | 80.51% | 37 | 1.80% | 7 | 0.34% | 3 | 0.15% | 2,057 | ||
| Matagorda | 3,500 | 28.70% | 8,366 | 68.60% | 239 | 1.96% | 53 | 0.43% | 38 | 0.31% | 12,196 | ||
| Maverick | 10,397 | 76.52% | 2,816 | 20.72% | 266 | 1.96% | 109 | 0.80% | 0 | 0.00% | 13,588 | ||
| McCulloch | 482 | 15.53% | 2,552 | 82.24% | 51 | 1.64% | 9 | 0.29% | 9 | 0.29% | 3,103 | ||
| McLennan | 27,063 | 34.22% | 48,260 | 61.03% | 2,492 | 3.15% | 473 | 0.60% | 787 | 1.00% | 79,075 | ||
| McMullen | 40 | 8.02% | 454 | 90.98% | 2 | 0.40% | 1 | 0.20% | 2 | 0.40% | 499 | ||
| Medina | 4,634 | 26.87% | 12,085 | 70.07% | 403 | 2.34% | 106 | 0.61% | 18 | 0.10% | 17,246 | ||
| Menard | 154 | 17.82% | 682 | 78.94% | 25 | 2.89% | 1 | 0.12% | 2 | 0.23% | 864 | ||
| Midland | 10,025 | 20.37% | 36,973 | 75.13% | 1,667 | 3.39% | 203 | 0.41% | 344 | 0.70% | 49,212 | ||
| Milam | 2,051 | 23.67% | 6,364 | 73.45% | 178 | 2.05% | 49 | 0.57% | 22 | 0.25% | 8,664 | ||
| Mills | 243 | 10.82% | 1,951 | 86.90% | 41 | 1.83% | 6 | 0.27% | 4 | 0.18% | 2,245 | ||
| Mitchell | 354 | 16.12% | 1,780 | 81.06% | 50 | 2.28% | 7 | 0.32% | 5 | 0.23% | 2,196 | ||
| Montague | 885 | 10.29% | 7,526 | 87.47% | 170 | 1.98% | 23 | 0.27% | 0 | 0.00% | 8,604 | ||
| Montgomery | 45,835 | 22.40% | 150,314 | 73.46% | 6,142 | 3.00% | 1,018 | 0.50% | 1,323 | 0.65% | 204,632 | ||
| Moore | 1,098 | 20.78% | 3,977 | 75.26% | 166 | 3.14% | 26 | 0.49% | 17 | 0.32% | 5,284 | ||
| Morris | 1,425 | 28.65% | 3,446 | 69.29% | 77 | 1.55% | 19 | 0.38% | 6 | 0.12% | 4,973 | ||
| Motley | 40 | 6.50% | 566 | 92.03% | 9 | 1.46% | 0 | 0.00% | 0 | 0.00% | 615 | ||
| Nacogdoches | 6,846 | 30.26% | 14,771 | 65.29% | 702 | 3.10% | 159 | 0.70% | 144 | 0.64% | 22,622 | ||
| Navarro | 4,002 | 24.35% | 11,994 | 72.99% | 343 | 2.09% | 58 | 0.35% | 36 | 0.22% | 16,433 | ||
| Newton | 1,156 | 20.89% | 4,288 | 77.48% | 66 | 1.19% | 13 | 0.23% | 11 | 0.20% | 5,534 | ||
| Nolan | 1,029 | 21.19% | 3,552 | 73.13% | 142 | 2.92% | 22 | 0.45% | 112 | 2.31% | 4,857 | ||
| Nueces | 49,198 | 47.12% | 50,766 | 48.62% | 3,324 | 3.18% | 847 | 0.81% | 270 | 0.26% | 104,405 | ||
| Ochiltree | 274 | 9.13% | 2,628 | 87.54% | 75 | 2.50% | 5 | 0.17% | 20 | 0.67% | 3,002 | ||
| Oldham | 78 | 8.23% | 850 | 89.66% | 14 | 1.48% | 3 | 0.32% | 3 | 0.32% | 948 | ||
| Orange | 5,735 | 17.92% | 25,513 | 79.73% | 550 | 1.72% | 115 | 0.36% | 87 | 0.27% | 32,000 | ||
| Palo Pinto | 1,708 | 16.63% | 8,284 | 80.66% | 210 | 2.04% | 48 | 0.47% | 20 | 0.19% | 10,270 | ||
| Panola | 1,835 | 17.62% | 8,445 | 81.08% | 109 | 1.05% | 24 | 0.23% | 3 | 0.03% | 10,416 | ||
| Parker | 8,344 | 14.69% | 46,473 | 81.79% | 1,439 | 2.53% | 215 | 0.38% | 346 | 0.61% | 56,817 | ||
| Parmer | 485 | 19.67% | 1,915 | 77.66% | 55 | 2.23% | 4 | 0.16% | 7 | 0.28% | 2,466 | ||
| Pecos | 1,554 | 37.13% | 2,468 | 58.97% | 127 | 3.03% | 26 | 0.62% | 10 | 0.24% | 4,185 | ||
| Polk | 4,187 | 21.09% | 15,176 | 76.45% | 367 | 1.85% | 86 | 0.43% | 36 | 0.18% | 19,852 | ||
| Potter | 7,657 | 26.73% | 19,630 | 68.51% | 1,028 | 3.59% | 190 | 0.66% | 146 | 0.51% | 28,651 | ||
| Presidio | 1,458 | 66.03% | 652 | 29.53% | 64 | 2.90% | 29 | 1.31% | 5 | 0.23% | 2,208 | ||
| Rains | 628 | 13.36% | 3,968 | 84.41% | 80 | 1.70% | 15 | 0.32% | 10 | 0.21% | 4,701 | ||
| Randall | 8,367 | 15.41% | 43,462 | 80.03% | 1,872 | 3.45% | 228 | 0.42% | 376 | 0.69% | 54,305 | ||
| Reagan | 167 | 18.47% | 709 | 78.43% | 22 | 2.43% | 2 | 0.22% | 4 | 0.44% | 904 | ||
| Real | 262 | 15.59% | 1,382 | 82.21% | 28 | 1.67% | 6 | 0.36% | 3 | 0.18% | 1,681 | ||
| Red River | 1,149 | 22.26% | 3,926 | 76.07% | 67 | 1.30% | 8 | 0.16% | 11 | 0.21% | 5,161 | ||
| Reeves | 1,659 | 52.10% | 1,417 | 44.50% | 98 | 3.08% | 10 | 0.31% | 0 | 0.00% | 3,184 | ||
| Refugio | 1,034 | 35.07% | 1,830 | 62.08% | 71 | 2.41% | 10 | 0.34% | 3 | 0.10% | 2,948 | ||
| Roberts | 20 | 3.61% | 524 | 94.58% | 6 | 1.08% | 0 | 0.00% | 4 | 0.72% | 554 | ||
| Robertson | 2,203 | 31.31% | 4,668 | 66.35% | 125 | 1.78% | 17 | 0.24% | 22 | 0.31% | 7,035 | ||
| Rockwall | 9,655 | 24.17% | 28,451 | 71.22% | 1,305 | 3.27% | 207 | 0.52% | 330 | 0.83% | 39,948 | ||
| Runnels | 453 | 11.98% | 3,250 | 85.93% | 60 | 1.59% | 13 | 0.34% | 6 | 0.16% | 3,782 | ||
| Rusk | 3,935 | 20.72% | 14,675 | 77.26% | 333 | 1.75% | 51 | 0.27% | 0 | 0.00% | 18,994 | ||
| Sabine | 614 | 13.20% | 3,998 | 85.96% | 27 | 0.58% | 9 | 0.19% | 3 | 0.06% | 4,651 | ||
| San Augustine | 910 | 25.50% | 2,622 | 73.47% | 30 | 0.84% | 6 | 0.17% | 1 | 0.03% | 3,569 | ||
| San Jacinto | 2,038 | 19.70% | 8,059 | 77.92% | 170 | 1.64% | 52 | 0.50% | 24 | 0.23% | 10,343 | ||
| San Patricio | 7,871 | 36.35% | 13,030 | 60.17% | 573 | 2.65% | 113 | 0.52% | 69 | 0.32% | 21,656 | ||
| San Saba | 293 | 12.43% | 2,025 | 85.91% | 32 | 1.36% | 4 | 0.17% | 3 | 0.13% | 2,357 | ||
| Schleicher | 208 | 19.64% | 821 | 77.53% | 24 | 2.27% | 3 | 0.28% | 3 | 0.28% | 1,059 | ||
| Scurry | 733 | 13.86% | 4,410 | 83.38% | 103 | 1.95% | 22 | 0.42% | 21 | 0.40% | 5,289 | ||
| Shackelford | 103 | 6.85% | 1,378 | 91.62% | 21 | 1.40% | 0 | 0.00% | 2 | 0.13% | 1,504 | ||
| Shelby | 1,758 | 19.35% | 7,179 | 79.01% | 123 | 1.35% | 21 | 0.23% | 5 | 0.06% | 9,086 | ||
| Sherman | 96 | 10.27% | 807 | 86.31% | 27 | 2.89% | 3 | 0.32% | 2 | 0.21% | 935 | ||
| Smith | 22,300 | 26.31% | 58,930 | 69.52% | 2,076 | 2.45% | 341 | 0.40% | 1,121 | 1.32% | 84,768 | ||
| Somervell | 541 | 13.88% | 3,206 | 82.27% | 107 | 2.75% | 23 | 0.59% | 20 | 0.51% | 3,897 | ||
| Starr | 9,289 | 79.12% | 2,224 | 18.94% | 159 | 1.35% | 68 | 0.58% | 0 | 0.00% | 11,740 | ||
| Stephens | 348 | 10.05% | 3,034 | 87.66% | 65 | 1.88% | 7 | 0.20% | 7 | 0.20% | 3,461 | ||
| Sterling | 70 | 11.06% | 549 | 86.73% | 9 | 1.42% | 5 | 0.79% | 0 | 0.00% | 633 | ||
| Stonewall | 135 | 19.26% | 555 | 79.17% | 10 | 1.43% | 1 | 0.14% | 0 | 0.00% | 701 | ||
| Sutton | 313 | 22.10% | 1,075 | 75.92% | 22 | 1.55% | 5 | 0.35% | 1 | 0.07% | 1,416 | ||
| Swisher | 462 | 20.96% | 1,671 | 75.82% | 51 | 2.31% | 6 | 0.27% | 14 | 0.64% | 2,204 | ||
| Tarrant | 288,392 | 43.14% | 345,921 | 51.74% | 23,775 | 3.56% | 5,413 | 0.81% | 5,013 | 0.75% | 668,514 | ||
| Taylor | 10,085 | 22.04% | 33,250 | 72.66% | 1,763 | 3.85% | 289 | 0.63% | 372 | 0.81% | 45,759 | ||
| Terrell | 140 | 31.96% | 288 | 65.75% | 10 | 2.28% | 0 | 0.00% | 0 | 0.00% | 438 | ||
| Terry | 753 | 22.44% | 2,459 | 73.29% | 112 | 3.34% | 21 | 0.63% | 10 | 0.30% | 3,355 | ||
| Throckmorton | 84 | 10.40% | 715 | 88.49% | 7 | 0.87% | 2 | 0.25% | 0 | 0.00% | 808 | ||
| Titus | 2,597 | 27.57% | 6,511 | 69.13% | 191 | 2.03% | 44 | 0.47% | 76 | 0.81% | 9,419 | ||
| Tom Green | 9,173 | 23.84% | 27,494 | 71.45% | 1,402 | 3.64% | 218 | 0.57% | 192 | 0.50% | 38,479 | ||
| Travis | 308,260 | 65.77% | 127,209 | 27.14% | 21,958 | 4.68% | 7,462 | 1.59% | 3,831 | 0.82% | 468,720 | ||
| Trinity | 1,154 | 19.28% | 4,737 | 79.15% | 80 | 1.34% | 11 | 0.18% | 3 | 0.05% | 5,985 | ||
| Tyler | 1,248 | 15.57% | 6,624 | 82.63% | 103 | 1.28% | 22 | 0.27% | 19 | 0.24% | 8,016 | ||
| Upshur | 2,380 | 14.86% | 13,209 | 82.49% | 283 | 1.77% | 59 | 0.37% | 82 | 0.51% | 16,013 | ||
| Upton | 286 | 21.23% | 1,007 | 74.76% | 49 | 3.64% | 3 | 0.22% | 2 | 0.15% | 1,347 | ||
| Uvalde | 3,867 | 43.14% | 4,835 | 53.94% | 191 | 2.13% | 54 | 0.60% | 17 | 0.19% | 8,964 | ||
| Val Verde | 6,964 | 51.14% | 5,890 | 43.25% | 573 | 4.21% | 131 | 0.96% | 59 | 0.43% | 13,617 | ||
| Van Zandt | 2,799 | 12.79% | 18,473 | 84.39% | 385 | 1.76% | 77 | 0.35% | 156 | 0.71% | 21,890 | ||
| Victoria | 8,866 | 28.49% | 21,275 | 68.36% | 782 | 2.51% | 156 | 0.50% | 44 | 0.14% | 31,123 | ||
| Walker | 6,091 | 30.77% | 12,884 | 65.08% | 560 | 2.83% | 161 | 0.81% | 100 | 0.51% | 19,796 | ||
| Waller | 5,748 | 34.25% | 10,531 | 62.74% | 342 | 2.04% | 104 | 0.62% | 59 | 0.35% | 16,784 | ||
| Ward | 783 | 22.73% | 2,547 | 73.93% | 82 | 2.38% | 10 | 0.29% | 23 | 0.67% | 3,445 | ||
| Washington | 3,382 | 22.81% | 10,945 | 73.81% | 352 | 2.37% | 70 | 0.47% | 79 | 0.53% | 14,828 | ||
| Webb | 42,307 | 74.35% | 12,947 | 22.75% | 1,033 | 1.82% | 591 | 1.04% | 27 | 0.05% | 56,905 | ||
| Wharton | 4,238 | 28.77% | 10,149 | 68.89% | 269 | 1.83% | 51 | 0.35% | 25 | 0.17% | 14,732 | ||
| Wheeler | 194 | 8.41% | 2,087 | 90.50% | 21 | 0.91% | 4 | 0.17% | 0 | 0.00% | 2,306 | ||
| Wichita | 8,770 | 23.01% | 27,631 | 72.49% | 1,308 | 3.43% | 256 | 0.67% | 154 | 0.40% | 38,119 | ||
| Wilbarger | 809 | 19.71% | 3,166 | 77.13% | 115 | 2.80% | 13 | 0.32% | 2 | 0.05% | 4,105 | ||
| Willacy | 3,422 | 67.16% | 1,547 | 30.36% | 95 | 1.86% | 31 | 0.61% | 0 | 0.00% | 5,095 | ||
| Williamson | 84,468 | 41.59% | 104,175 | 51.30% | 10,229 | 5.04% | 2,047 | 1.01% | 2,162 | 1.06% | 203,081 | ||
| Wilson | 4,790 | 24.65% | 13,998 | 72.04% | 392 | 2.02% | 82 | 0.42% | 170 | 0.87% | 19,432 | ||
| Winkler | 420 | 22.39% | 1,403 | 74.79% | 49 | 2.61% | 1 | 0.05% | 3 | 0.16% | 1,876 | ||
| Wise | 3,412 | 13.77% | 20,670 | 83.43% | 505 | 2.04% | 91 | 0.37% | 98 | 0.40% | 24,776 | ||
| Wood | 2,630 | 14.04% | 15,700 | 83.84% | 280 | 1.50% | 64 | 0.34% | 53 | 0.28% | 18,727 | ||
| Yoakum | 426 | 18.50% | 1,797 | 78.03% | 73 | 3.17% | 3 | 0.13% | 4 | 0.17% | 2,303 | ||
| Young | 876 | 11.37% | 6,601 | 85.65% | 180 | 2.34% | 19 | 0.25% | 31 | 0.40% | 7,707 | ||
| Zapata | 2,063 | 65.66% | 1,029 | 32.75% | 34 | 1.08% | 16 | 0.51% | 0 | 0.00% | 3,142 | ||
| Zavala | 2,636 | 77.62% | 694 | 20.44% | 50 | 1.47% | 16 | 0.47% | 0 | 0.00% | 3,396 | ||
| Total | 3,877,868 | 43.24% | 4,685,047 | 52.23% | 283,492 | 3.16% | 71,558 | 0.80% | 51,261 | 0.57% | 8,969,226 | ||
| Democratic
Hold Gain from Republican |
Republican
Hold Gain from Democratic |
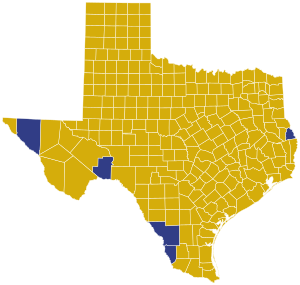
Counties that flipped from Democratic to Republican[edit]
Counties that flipped from Republican to Democratic[edit]
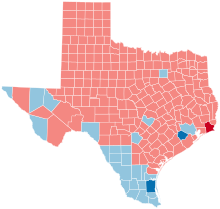
By congressional district[edit]
Trump won 22 of 36 congressional districts, while Clinton won 14, including three held by Republicans [35]
Analysis[edit]
While he continued the Republican 10-cycle winning streak in Texas,[36] Trump’s winning margin was down from Mitt Romney’s 16% in 2012 to 8.99%, a 7.01% drop, making 2016 the closest Democrats had come to winning Texas since 1996 (though the Democrats also received a smaller percentage of the vote in Texas in this election than in the 2008 presidential election). The surge in Democratic votes can partly be attributed to a growing population of Hispanics/Latinos, Trump’s relatively weak performance with college-educated white voters, and the growth of cities and their respective suburbs in the Texas Triangle region, which are heavily populated with both college-educated voters and minorities and thus swung more Democratic compared to 2012.[37] These were Clinton’s main sources of votes. She swept the Rio Grande region counties, such as El Paso, Webb, Hidalgo and Cameron as they have sizable Hispanic populations. Clinton scored a 38-point sweep in Travis County, home to the state capital and heavily liberal city of Austin, the best Democratic performance in the county since 1964. She became the first Democrat to break 60% of the vote in Dallas County since 1944. Furthermore, she outperformed Obama in the minority-heavy counties of Bexar (San Antonio) and Harris County (Houston), shifting his slim victories into double-digit leads.[38] In fact, the Presidential vote in Texas’ 7th Congressional District, which includes Houston’s inner-west suburbs, had the biggest change in margin towards Clinton compared to Obama’s 2012 performance outside of Utah, shifting 23 points left.[39] Clinton also won suburban Fort Bend County for the first time since Texas native Lyndon B. Johnson in 1964, which was attributed to the county’s large immigrant population and negative perception of Trump by female Republican voters.[40] While Clinton didn’t win suburban counties such as Denton County, Williamson County, Collin County, or Hays County, her margin of defeat was much narrower than other Democratic presidential nominees. Trump on the other hand narrowly flipped Jefferson County in East Texas, becoming the first Republican since Richard Nixon in 1972 to win the county.[41] Places that had large numbers of young voters in the state were a stronghold for Clinton as well.[42] Texas Lieutenant Governor Dan Patrick suggested that Trump’s relatively small margin of victory could have been largely due to many moderate Republican voters who had supported Romney in 2012 staying home. In an interview conducted the morning after the election, Patrick said in reference to these voters, “Had they turned out, he would’ve been in the low teens”.[43]
In total, Clinton beat Trump in 27 counties by a total of 883,819 votes, and had the best percentage performance than any other Democrat running statewide. Conversely, Trump, who won 227 of the state’s 254 counties, got the smallest percentage of the vote of all Republicans running in the state.[44]
See also[edit]
References[edit]
- ^ “Turnout and Voter Registration Figures (1970-current)”.
- ^ “Vote Swing – 2016 Presidential General Election Data – National”. Dave Leip’s Atlas of U.S. Presidential Elections. Retrieved October 27, 2018.
- ^ “Texas Democratic Delegation 2016”. www.thegreenpapers.com. Retrieved February 23, 2017.
- ^ “Race Summary Report: 2016 Democratic Party Primary Election”. Texas Secretary of State. March 1, 2016. Retrieved July 14, 2016.
- ^ “Inside the Beltway: Donald Trump won’t participate in Megyn Kelly’s Fox News candidate forum”. The Washington Times.
- ^ SPRUNT, BARBARA (February 25, 2016). “On The Clock: Trump Dominated Debate In Speaking Time”. NPR. Retrieved February 25, 2016.
- ^ “Election 2016 – 2016 Republican Presidential Nomination”. RealClearPolitics. Retrieved November 13, 2016.
- ^ “Debate fallout: GOP suspends debate partnership with NBC”. Washington Examiner. October 30, 2015. Retrieved October 30, 2015.
- ^ “RNC CANCELS ONLY DEBATE TO AIR ON SPANISH-LANGUAGE TV”. Newsweek.com. October 30, 2015. Retrieved January 14, 2016.
- ^ “NBC replaced by CNN for GOP’s Super Tuesday debate”. CNN Money. January 18, 2016. Retrieved January 18, 2016.
- ^ “National Review Kicked Out of GOP Debate After Anti-Trump Stand”. Wall Street Journal. January 22, 2016.
- ^ Watkins, Eli (February 19, 2016). “CNN’s Wolf Blitzer will moderate Republican debate in Houston”. CNN. Retrieved February 22, 2016.
- ^ “Texas Republican Delegation 2016”. www.thegreenpapers.com. Retrieved February 23, 2017.
- ^ “Race Summary Report: 2016 Republican Party Primary Election”. Texas Secretary of State. March 1, 2016. Retrieved July 14, 2016.
- ^ “Time to Vote Green- March 8”. Green Party of Texas. August 21, 2015. Retrieved March 12, 2016.
- ^ “2016 County Nominating Conventions”. Green Party of Texas. December 4, 2015. Retrieved March 12, 2016.
- ^ “2016 District Nominating Conventions”. Green Party of Texas. December 4, 2015. Retrieved March 12, 2016.
- ^ “2016 State Nominating Convention”. Green Party of Texas. August 21, 2015. Retrieved March 12, 2015.
- ^ “Stein wins majority of Texas convention delegates”. Retrieved April 11, 2016.
- ^ “RealClearPolitics – Election 2016 – Texas: Trump vs. Clinton”.
- ^ “Our final map has Clinton winning with 352 electoral votes. Compare your picks with ours”. Los Angeles Times. November 6, 2016. Retrieved November 13, 2016.
- ^ “Road to 270: CNN’s general election map – CNNPolitics.com”. Cnn.com. November 8, 2016. Retrieved November 13, 2016.
- ^ “Presidential Ratings”. The Rothenberg Political Report. Retrieved August 16, 2021.
- ^ “Larry J. Sabato’s Crystal Ball » 2016 President”. Centerforpolitics.org. November 7, 2016. Retrieved November 13, 2016.
- ^ Todd, Chuck. “NBC’s Final Battleground Map Shows Clinton With a Significant Lead”. NBC News. Retrieved November 13, 2016.
- ^ “ElectoralVote”. ElectoralVote. December 31, 2000. Retrieved November 13, 2016.
- ^ “2016 Election Maps – Battle for White House”. RealClearPolitics. Retrieved November 13, 2016.
- ^ “Electoral Scorecard: Map shifts again in Trump’s favor, as Clinton holds edge”. Fox News. November 7, 2016. Retrieved November 13, 2016.
- ^ “Electoral Map 2016: Forecast Who Will Win-Clinton or Trump”. Abcnews.go.com. Retrieved November 13, 2016.
- ^ “Texas hits record high for early voting turnout”. October 27, 2020.
- ^ “Race Summary Report, 2016 General Election”. Texas Secretary of State. Retrieved December 1, 2016.
- ^ Lau, Ryan (February 3, 2018). “Ron Paul Attacks Libertarian Leadership in Response to Controversy”. 71Republic. Archived from the original on February 4, 2018. Retrieved February 3, 2018.
I paid my lifetime membership, in 1987, with a gold coin, to make a point.
- ^ “Turnout and Voter Registration Figures (1970-current)”. www.sos.state.tx.us. Retrieved January 3, 2017.
- ^ “2016 General Election Results”. Retrieved December 23, 2016.
- ^ “Introducing the 2017 Cook Political Report Partisan Voter Index”. The Cook Political Report.
- ^ “Texas – 270toWin”.
- ^ Rogers, Mary Beth (January 31, 2016). “Turning Texas blue?: 3 trends could undo the 20 years of Republican rule Texas has endured since the days of Ann Richards”. Salon. Retrieved March 10, 2017.
- ^ Tribune, The Texas (November 11, 2016). “There’s no shading it, Harris County went undeniably blue”. The Texas Tribune. Retrieved March 9, 2017.
- ^ “Daily Kos Elections 2012, 2016 & 2020 presidential election results for congressional districts used in 2020 elections”. Google Docs. Retrieved January 27, 2023.
- ^ Quinn, Kevin (November 9, 2016). “Political shift in Ft. Bend leans toward Clinton”. KTRK-TV.
- ^ “Texas County Elects Black Woman Sheriff and Votes for Trump”.
- ^ “Trump across Texas, visualized”. Houston Chronicle. Retrieved March 9, 2017.
- ^ Svitek, Patrick (November 9, 2016). “Donald Trump wins Texas, leads Hillary Clinton by 9 points”. The Texas Tribune. Retrieved December 25, 2018.
- ^ Tribune, The Texas (November 11, 2016). “Analysis: The blue dots in Texas’ red political sea”. The Texas Tribune. Retrieved March 9, 2017.
Further reading[edit]
External links[edit]
Recent Comments