2014 United Kingdom local elections
The 2014 United Kingdom local elections were held on 22 May 2014. Usually these elections are held on the first Thursday in May but were postponed to coincide with the 2014 European Parliament Elections. Direct elections were held for all 32 London boroughs, all 36 metropolitan boroughs, 74 district/borough councils, 19 unitary authorities and various mayoral posts in England and elections to the new councils in Northern Ireland.
All registered electors (British, Irish, Commonwealth and European Union citizens) who were aged 18 or over on the day of the election were entitled to vote in the local elections.
The BBC’s projected national vote share (PNV) put Labour on 31%, the Conservatives on 29%, UKIP on 17%, and the Liberal Democrats on 13%.[1]Rallings and Thrasher of Plymouth University’s national equivalent vote share (NEV) estimated 31% for Labour, 30% for the Conservatives, 18% for UKIP, and 11% for the Liberal Democrats.[2]
For the fourth year running, the Labour Party enjoyed the largest share of the vote in local elections, but its share of the vote was its smallest since 2010. UKIP, which topped the same day’s European Parliament elections, finished third in vote share, claiming council seats from Labour, the Conservatives and Liberal Democrats.
Overview of results[edit]
UK-wide results[edit]
England results[edit]
The Respect Party lost both their remaining councillors.[3]
English Councils – shift of control[edit]
This table depicts how the control of local councils shifted in this election.
The data along the diagonal represents no shift in control in that number of councils: for example, Chorley was among the solid colour no change 73 Labour controlled councils. The other cells represent the shifts of control: for example, Harrow was one of five councils of which Labour gained control from No Overall Control. The intensity of the colour in a table cell other than the diagonal reflects the relative number of losses in council control suffered by each party.
| after election → | N.O.C. | Labour | Cons. | Lib. Dem. |
Old total |
losses |
|---|---|---|---|---|---|---|
| ↓ before election | ||||||
| No Overall Control | 19 | 5 | – | – | 24 | − 5 |
| Labour | 4 | 73 | – | – | 77 | − 4 |
| Conservative | 8 | 4 | 40 | – | 52 | −12 |
| Liberal Democrats | 1 | – | 1 | 6 | 8 | − 2 |
| New total | 32 | 82 | 41 | 6 | 161 | – |
| gains | +13 | + 9 | + 1 | – | – | – |
| Net change | + 8 | + 5 | −11 | − 2 | – | – |
Last updated at 11:30:10 on 27 May 2014[4]
Northern Ireland results[edit]
| Party | Councillors | % of councillors | First preference votes | % of FP votes | |||||||||
|---|---|---|---|---|---|---|---|---|---|---|---|---|---|
| 2011[5] | 2014 | +/- | 2011[5] | 2014 | +/- | 2011[6] | 2014[7] | +/- | 2011 | 2014 | +/- | ||
| DUP | 145 | 130 | 31.4% | 28.1% | 179,436 | 144,928 | 27.2% | 23.1% | |||||
| Sinn Féin | 115 | 105 | 24.9% | 22.7% | 163,712 | 151,137 | 24.8% | 24.1% | |||||
| Ulster Unionist | 77 | 88 | 16.7% | 19.0% | 100,643 | 101,385 | 15.2% | 16.1% | |||||
| SDLP | 67 | 66 | 14.5% | 14.2% | 99,325 | 85,237 | 15.0% | 13.6% | |||||
| Alliance | 34 | 32 | 7.4% | 6.9% | 48,859 | 41,769 | 7.4% | 6.7% | |||||
| TUV | 3 | 13 | 0.6% | 2.8% | 13,079 | 28,310 | 2.0% | 4.5% | |||||
| PUP | 1 | 4 | 0.2% | 0.8% | 3,858 | 12,753 | 0.6% | 2.0% | |||||
| Green (NI) | 1 | 4 | 0.2% | 0.8% | 6,317 | 5,515 | 1.0% | 0.8% | |||||
| UKIP | 1 | 3 | 0.2% | 0.6% | 2,550 | 9,311 | 0.4% | 1.4% | |||||
| NI21 | 0 | 1 | 0.0% | 0.2% | 0 | 11,495 | 0.0% | 1.8% | |||||
| People Before Profit | 0 | 1 | 0.0% | 0.2% | 1,721 | 1,923 | 0.3% | 0.3% | |||||
| NI Conservatives | 0 | 0 | 0.0% | 0.0% | 1,321 | 2,527 | 0.2% | 0.4% | |||||
| éirígí | 0 | 0 | 0.0% | 0.0% | 2,062 | 1,756 | 0.3% | 0.3% | |||||
| Workers’ Party | 0 | 0 | 0.0% | 0.0% | 760 | 985 | 0.1 | 0.2% | |||||
| Fermanagh Against Fracking | 0 | 0 | 0.0% | 0.0% | 0 | 555 | 0.0% | 0.1% | |||||
| Republican Network for Unity | 0 | 0 | 0.0% | 0.0% | 0 | 502 | 0.0% | 0.1% | |||||
| Community Partnership | 0 | 0 | 0.0% | 0.0% | 800 | 388 | 0.1 | 0.1% | |||||
| Socialist Party | 0 | 0 | 0.0% | 0.0% | 682 | 272 | 0.1% | 0.0% | |||||
| BNP | 0 | 0 | 0.0% | 0.0% | 491 | 174 | 0.1% | 0.0% | |||||
| Democracy First | 0 | 0 | 0.0% | 0.0% | 0 | 173 | 0.0% | 0.0% | |||||
| Others | 0 | 0 | 0.0% | 0.0% | 2,142 | 0 | 0.3% | 0.0% | |||||
| Independent | 18 | 15 | 3.9% | 3.2% | 32,151 | 26,682 | 4.9% | 4.2% | |||||
| Total | 462 | 462 | 100% | 100% | 660,631 | 627,777 | 100% | 100% | |||||
London boroughs[edit]
All seats in the 32 London Borough Councils were up for election.
Summary of results[edit]
| Party[8] | Votes won | % votes | Change | Seats | % seats | Change | Councils | Change | |
|---|---|---|---|---|---|---|---|---|---|
| Labour | 944,967 | 37.6 | +5.1 | 1,060 | 57.3 | +185 | 20 | +3 | |
| Conservative | 663,847 | 26.4 | −5.3 | 612 | 33.1 | −105 | 9 | −2 | |
| Liberal Democrats | 267,769 | 10.6 | −11.8 | 116 | 6.3 | −130 | 1 | −1 | |
| Green | 246,805 | 9.8 | +3.2 | 4 | 0.2 | +2 | 0 | ±0 | |
| UKIP | 239,001 | 9.5 | +8.4 | 12 | 0.6 | +12 | 0 | ±0 | |
| Others | 152,684 | 6.1 | +0.4 | 47 | 2.5 | +26 | 0 | ±0 | |
| No overall control | — | 2 | −6 | ||||||
Individual council results[edit]
Harrow’s Council was elected in 2010 with a Labour majority but divisions within this majority in 2013 led to a coalition struck between the Conservatives and the Independent Labour Group (formed of eight ex-Labour councillors). Conservatives withdrew their support for Independent Labour on 16 September 2013 leading to a brief Conservative minority administration.
Metropolitan boroughs[edit]
One third of the seats in all 36 Metropolitan Boroughs were up for election (showing those elected and each party’s total in the new council).
| Council | Previous control | Result | |||||||
|---|---|---|---|---|---|---|---|---|---|
| Con | Lab | LD | UKIP | Others | |||||
| Barnsley | Labour | Labour | 1, 4 | 18, 52 | 2, 7 | ||||
| Birmingham | Labour | Labour | 13, 31 | 22, 77 | 5, 12 | ||||
| Bolton | Labour | Labour | 5, 15 | 13, 40 | 1, 3 | 2, 2 | |||
| Bradford | Labour | Labour | 7, 21 | 17, 46 | 3, 8 | 1, 1 | 1,3Grn 2,11Ind |
||
| Bury | Labour | Labour | 2, 11 | 15, 38 | 0, 1 | 0, 1 | |||
| Calderdale | No overall control | No overall control (Lab minority, then Con-Ind minority) |
6, 19 | 9, 25 | 1, 6 | 1, 1 | |||
| Coventry | Labour | Labour | 6, 11 | 13, 43 | |||||
| Doncaster | Labour | Labour | 3, 8 | 15, 48 | 1, 1 | 2, 6 | |||
| Dudley | Labour | Labour | 7, 20 | 10, 40 | 7, 9 | 0,1Grn 0,2Ind |
|||
| Gateshead | Labour | Labour | 18, 55 | 4, 11 | |||||
| Kirklees | No overall control | No overall control (Lab minority) |
6, 18 | 10, 32 | 5, 11 | 1,5Grn 1,3Ind |
|||
| Knowsley | Labour | Labour | 21, 63 | ||||||
| Leeds | Labour | Labour | 6, 19 | 20, 62 | 4, 9 | 1,3Grn 2,6Ind |
|||
| Liverpool | Labour | Labour | 27, 79 | 0, 3 | 2,4Grn 1,4Ind |
||||
| Manchester | Labour | Labour | 33, 95 | 1, 1 | |||||
| Newcastle upon Tyne | Labour | Labour | 18, 52 | 8, 24 | 0, 2 | ||||
| North Tyneside | Labour | Labour | 3, 12 | 15, 44 | 1, 4 | ||||
| Oldham | Labour | Labour | 0, 2 | 14, 45 | 3, 10 | 2, 2 | 1, 1 | ||
| Rochdale | Labour | Labour | 3, 11 | 16, 48 | 1, 1 | ||||
| Rotherham | Labour | Labour | 0, 2 | 11, 50 | 10, 10 | 0, 1 | |||
| St Helens | Labour | Labour | 1, 3 | 14, 43 | 1, 2 | ||||
| Salford | Labour | Labour | 3, 8 | 17, 52 | |||||
| Sandwell | Labour | Labour | 0, 1 | 23, 70 | 1, 1 | ||||
| Sefton | Labour | Labour | 2, 7 | 13, 40 | 6, 17 | 1, 2 | |||
| Sheffield | Labour | Labour | 18, 60 | 6, 17 | 3, 3 | 2,4Grn | |||
| Solihull | Conservative | Conservative | 9, 29 | 0, 2 | 3, 8 | 1, 1 | 4,10Grn | ||
| South Tyneside | Labour | Labour | 0, 1 | 17, 49 | 0, 1 | 1, 3 | |||
| Stockport | No overall control | No overall control (Lib Dem minority) |
4, 10 | 7, 22 | 9, 28 | 1, 3 | |||
| Sunderland | Labour | Labour | 3, 8 | 21, 63 | 1, 4 | ||||
| Tameside | Labour | Labour | 2, 6 | 17, 51 | |||||
| Trafford | Conservative | Conservative | 12, 33 | 9, 27 | 1, 3 | ||||
| Wakefield | Labour | Labour | 1, 6 | 17, 54 | 2, 2 | 1, 1 | |||
| Walsall | No overall control | No overall control (Lab minority) |
6, 21 | 9, 30 | 0, 3 | 3, 3 | 1, 3 | ||
| Wigan | Labour | Labour | 1, 2 | 23, 62 | 1, 11 | ||||
| Wirral | Labour | Labour | 8, 22 | 11, 37 | 2, 6 | 1,1Grn | |||
| Wolverhampton | Labour | Labour | 4, 12 | 15, 45 | 0, 2 | 1, 1 | |||
| Totals | 117, 373 |
563, 1,741 |
62, 189 |
33, 37 |
28, 104 |
||||
Unitary authorities[edit]
Two unitary authorities had all of their seats up for election following boundary changes.
One third of the council seats were up for election in 17 unitary authorities (elected and totals shown).
Non-metropolitan districts[edit]
Whole council[edit]
- Two district councils had all of their seats up for election following boundary changes
Half of council[edit]
- Seven district councils had half of their seats up for election (showing those elected and the new council)
| Council | Previous control | Result | |||||||
|---|---|---|---|---|---|---|---|---|---|
| Con | Lab | LD | UKIP | Others | |||||
| Adur | Conservative | Conservative | 9, 20 | 0, 1 | 4, 6 | 1, 2 | |||
| Cheltenham | Liberal Democrats | Liberal Democrats | 4, 11 | 13, 24 | 2, 5 | ||||
| Fareham | Conservative | Conservative | 11, 23 | 3, 5 | 1, 1 | 1, 2 | |||
| Gosport | Conservative | Conservative | 12, 21 | 2, 6 | 2, 6 | 0, 1 | |||
| Hastings | Labour | Labour | 5, 8 | 11, 24 | |||||
| Nuneaton and Bedworth | Labour | Labour | 2, 3 | 14, 28 | 1,2Grn 0,1Ind |
||||
| Oxford | Labour | Labour | 17, 33 | 5, 8 | 3,6Grn 0,1Ind |
||||
| Totals | 43, 86 | 44, 92 | 23, 43 | 5, 8 | 7, 19 | ||||
Third of council[edit]
- 65 district councils had one third of their seats up for election
| Council | Previous control | Result | |||||||
|---|---|---|---|---|---|---|---|---|---|
| Con | Lab | LD | UKIP | Others | |||||
| Amber Valley | Conservative | Labour | 4, 21 | 11, 23 | 0, 1 | ||||
| Basildon | Conservative | No overall control Con minority | 4, 17 | 0, 10 | 0, 1 | 11, 12 | 0, 2 | ||
| Basingstoke and Deane | No overall control | No overall control Con minority | 8, 28 | 8, 17 | 3, 9 | 1, 2 | 2, 4 | ||
| Bassetlaw | Labour | Labour | 3, 11 | 12, 34 | 1, 3 | ||||
| Brentwood | Conservative | No overall control LibDem/Ind/Lab coalition | 6, 18 | 1, 3 | 5, 11 | 0, 5 | |||
| Broxbourne | Conservative | Conservative | 9, 26 | 1, 3 | 1, 1 | ||||
| Burnley | Labour | Labour | 1, 5 | 10, 28 | 4, 12 | ||||
| Cambridge | No overall control | Labour | 0, 1 | 10, 25 | 4, 14 | 1, 2 | |||
| Cannock Chase | Labour | Labour | 1, 6 | 6, 25 | 1, 2 | 4, 6 | 1, 2 | ||
| Carlisle | Labour | Labour | 7, 19 | 9, 29 | 0, 2 | 1, 2 | |||
| Castle Point | Conservative | No overall control Con minority | 20, 20 | 5, 5 | 0, 16 | ||||
| Cherwell | Conservative | Conservative | 12, 40 | 4, 7 | 1, 2 | 0, 1 | |||
| Chorley | Labour | Labour | 3, 13 | 13, 32 | 1, 2 | ||||
| Colchester | No overall control | No overall control LibDem/Lab/Ind coalition | 8, 23 | 2, 8 | 9, 25 | 1, 4 | |||
| Craven | Conservative | Conservative | 7, 18 | 0, 2 | 2, 10 | ||||
| Crawley | Conservative | Labour | 5, 16 | 8, 20 | 0, 1 | ||||
| Daventry | Conservative | Conservative | 10, 28 | 0, 4 | 0, 1 | 2, 3 | |||
| Eastleigh | Liberal Democrats | Liberal Democrats | 2, 4 | 13, 40 | |||||
| Elmbridge | Conservative | Conservative | 12, 33 | 2, 6 | 4, 21 | ||||
| Epping Forest | Conservative | Conservative | 0, 37 | 0, 1 | 2, 3 | 0, 2 | 0,1Grn 5,14Ind |
||
| Exeter | Labour | Labour | 2, 10 | 10, 27 | 1, 3 | ||||
| Gloucester | No overall control | No overall control Con minority | 8, 18 | 3, 9 | 4, 9 | ||||
| Great Yarmouth | Labour | No overall control Lab minority | 2, 14 | 1, 15 | 10, 10 | ||||
| Harlow | Labour | Labour | 3, 11 | 4, 17 | 5, 5 | ||||
| Harrogate | Conservative | Conservative | 9, 34 | 8, 15 | 2, 5 | ||||
| Havant | Conservative | Conservative | 10, 31 | 1, 4 | 1, 1 | 2, 2 | |||
| Hertsmere | Conservative | Conservative | 11, 34 | 2, 5 | |||||
| Huntingdonshire | Conservative | Conservative | 11, 34 | 0, 1 | 1, 6 | 3, 7 | 0,4Grn 2,3Ind |
||
| Hyndburn | Labour | Labour | 2, 8 | 7, 23 | 0, 2 | 2, 2 | |||
| Ipswich | Labour | Labour | 4, 10 | 12, 35 | 1, 3 | ||||
| Lincoln | Labour | Labour | 2, 6 | 9, 27 | |||||
| Maidstone | Conservative | No overall control Con minority | 5, 25 | 1, 2 | 9, 19 | 4, 4 | 1, 5 | ||
| Mole Valley | No overall control | No overall control | 6, 19 | 4, 15 | 1, 1 | 3, 6 | |||
| Newcastle-under-Lyme | Labour | Labour | 5, 16 | 11, 32 | 5, 6 | 0,5 | 0,1Grn | ||
| North Hertfordshire | Conservative | Conservative | 12, 33 | 5, 12 | 0, 3 | 0, 1 | |||
| Norwich | Labour | Labour | 8, 21 | 1, 3 | 5,15Grn | ||||
| Pendle | No overall control | No overall control | 5, 19 | 7, 18 | 3, 11 | 1, 1 | |||
| Preston | Labour | Labour | 6, 19 | 7, 32 | 2, 5 | 0, 1 | |||
| Purbeck † | No overall control | No overall control Con minority | 6, 12 | 2, 11 | 0, 1 | ||||
| Redditch | Labour | Labour | 3, 9 | 6, 17 | 2, 2 | 0, 1 | |||
| Reigate and Banstead | Conservative | Conservative | 12, 37 | 1, 2 | 1, 1 | 1,3Grn 2,8Ind |
|||
| Rochford | Conservative | Conservative | 6, 26 | 1, 1 | 1, 3 | 3, 3 | 1,2Grn 1,4Ind |
||
| Rossendale | Labour | Labour | 5, 10 | 6, 24 | 1, 2 | ||||
| Rugby | Conservative | Conservative | 7, 23 | 3, 10 | 3, 7 | 2, 2 | |||
| Runnymede | Conservative | Conservative | 12, 35 | 0, 1 | 2, 6 | ||||
| Rushmoor | Conservative | Conservative | 8, 24 | 4, 12 | 1, 3 | ||||
| St Albans | No overall control | No overall control Con minority | 12, 29 | 3, 10 | 7, 17 | 0,1Grn 0,1Ind |
|||
| South Cambridgeshire | Conservative | Conservative | 10, 35 | 0, 1 | 7, 13 | 2, 8 | |||
| South Lakeland | Liberal Democrats | Liberal Democrats | 2, 15 | 0, 3 | 15, 33 | ||||
| Stevenage | Labour | Labour | 2, 2 | 34, 34 | 3, 3 | ||||
| Stratford-on-Avon | Conservative | Conservative | 15, 35 | 0, 1 | 3, 12 | 0, 5 | |||
| Stroud | No overall control | No overall control Lab/Green/LibDem coalition | 10, 22 | 6, 20 | 0, 2 | 2,6Grn 0,1Ind |
|||
| Tamworth | Conservative | Conservative | 6, 16 | 3, 12 | 1, 1 | 0, 1 | |||
| Tandridge | Conservative | Conservative | 13, 34 | 1, 6 | 0, 2 | ||||
| Tunbridge Wells | Conservative | Conservative | 14, 38 | 1, 3 | 1, 3 | 0, 2 | 0, 2 | ||
| Watford | Liberal Democrats | Liberal Democrats | 1, 1 | 4, 11 | 7, 23 | 1,1Grn | |||
| Welwyn Hatfield | Conservative | Conservative | 13, 31 | 4, 14 | 1, 2 | 0, 1 | |||
| West Lancashire | Conservative | No overall control Con minority | 11, 27 | 8, 27 | |||||
| West Oxfordshire | Conservative | Conservative | 15, 40 | 1, 5 | 1, 3 | 0, 1 | |||
| Weymouth and Portland | No overall control | No overall control Lab/LibDem coalition | 4, 11 | 5, 15 | 1, 6 | 1, 1 | 1, 1 | ||
| Winchester | No overall control | No overall control Con minority | 11, 28 | 1, 3 | 7, 25 | 0, 1 | |||
| Woking | Conservative | Conservative | 7, 23 | 1, 1 | 3, 11 | 1, 1 | |||
| Worcester | No overall control | No overall control Con minority | 6, 17 | 6, 16 | 0, 1 | 0,1Grn | |||
| Worthing | Conservative | Conservative | 9, 27 | 1, 7 | 1, 1 | 1,1Grn 0,1Ind |
|||
| Wyre Forest | No overall control | No overall control | 5, 15 | 2, 9 | 5, 5 | 1, 13 | |||
| Totals | 446, 1,348 | 283, 796 | 163, 421 | 66, 88 | 47, 211 | ||||
† Elected councillors will hold office for one year only as Purbeck District will adopt whole council elections from 2015.[10][11]
Mayoral elections[edit]
There were five mayoral elections.
In Copeland, there was a referendum to establish a post of directly elected mayor, which passed.
Northern Ireland[edit]
These were the first elections to the 11 new ‘super-councils’ in Northern Ireland, following a reorganisation. These will operate in shadow form for one year, with the current 26 councils existing in parallel.[12]
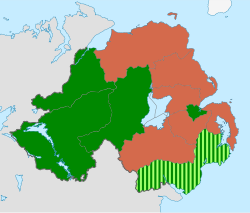
Sinn Féin (dark green) won more seats than any other party in (1) Belfast, (9) Mid-Ulster, (10) Derry & Strabane and (11) Fermanagh & Omagh. Sinn Féin and the SDLP elected more councillors (14 each) than did any other party in (5) Newry, Mourne & Down . The Democratic Unionist Party (dark orange) won more seats than any other party in each of the other six councils, and won as many as all the other parties combined in (4) Lisburn & Castlereagh.

Party composition of new councils[edit]
The party abbreviations in this table are explained in the total-vote table that follows it.
Votes cast[edit]
These elections used the Single Transferable Vote method of proportional representation. Votes and percentages for each party reflect the first preference on each ballot.
| Party | Councillors | % of councillors | First preference votes | % of FP votes | |||||||||
|---|---|---|---|---|---|---|---|---|---|---|---|---|---|
| 2011 (notional)[13] | 2014 | +/- | 2011 (notional) | 2014 | +/- | 2011[6] | 2014[7] | +/- | 2011 | 2014 | +/- | ||
| DUP | 145 | 130 | 31.4% | 28.1% | 179,436 | 144,928 | 27.2% | 23.1% | |||||
| Sinn Féin | 115 | 105 | 24.9% | 22.7% | 163,712 | 151,137 | 24.8% | 24.1% | |||||
| Ulster Unionist | 77 | 88 | 16.7% | 19.0% | 100,643 | 101,385 | 15.2% | 16.1% | |||||
| SDLP | 67 | 66 | 14.5% | 14.2% | 99,325 | 85,237 | 15.0% | 13.6% | |||||
| Alliance | 34 | 32 | 7.4% | 6.9% | 48,859 | 41,769 | 7.4% | 6.7% | |||||
| TUV | 3 | 13 | 0.6% | 2.8% | 13,079 | 28,310 | 2.0% | 4.5% | |||||
| PUP | 1 | 4 | 0.2% | 0.8% | 3,858 | 12,753 | 0.6% | 2.0% | |||||
| Green (NI) | 1 | 4 | 0.2% | 0.8% | 6,317 | 5,515 | 1.0% | 0.8% | |||||
| UKIP | 1 | 3 | 0.2% | 0.6% | 2,550 | 9,311 | 0.4% | 1.4% | |||||
| NI21 | 0 | 1 | 0.0% | 0.2% | 0 | 11,495 | 0.0% | 1.8% | |||||
| People Before Profit | 0 | 1 | 0.0% | 0.2% | 1,721 | 1,923 | 0.3% | 0.3% | |||||
| NI Conservatives | 0 | 0 | 0.0% | 0.0% | 1,321 | 2,527 | 0.2% | 0.4% | |||||
| éirígí | 0 | 0 | 0.0% | 0.0% | 2,062 | 1,756 | 0.3% | 0.3% | |||||
| Workers’ Party | 0 | 0 | 0.0% | 0.0% | 760 | 985 | 0.1 | 0.2% | |||||
| Fermanagh Against Fracking | 0 | 0 | 0.0% | 0.0% | 0 | 555 | 0.0% | 0.1% | |||||
| Republican Network for Unity | 0 | 0 | 0.0% | 0.0% | 0 | 502 | 0.0% | 0.1% | |||||
| Community Partnership | 0 | 0 | 0.0% | 0.0% | 800 | 388 | 0.1 | 0.1% | |||||
| Socialist Party | 0 | 0 | 0.0% | 0.0% | 682 | 272 | 0.1% | 0.0% | |||||
| BNP | 0 | 0 | 0.0% | 0.0% | 491 | 174 | 0.1% | 0.0% | |||||
| Democracy First | 0 | 0 | 0.0% | 0.0% | 0 | 173 | 0.0% | 0.0% | |||||
| Others | 0 | 0 | 0.0% | 0.0% | 2,142 | 0 | 0.3% | 0.0% | |||||
| Independent | 18 | 15 | 3.9% | 3.2% | 32,151 | 26,682 | 4.9% | 4.2% | |||||
| Total | 462 | 462 | 100% | 100% | 660,631 | 627,777 | 100% | 100% | |||||
Electoral administration[edit]
Eligibility to vote[edit]
All registered electors (British, Irish, Commonwealth and European Union citizens) who were aged 18 or over on the day of the election were entitled to vote in the local elections. Those who were temporarily away from their ordinary address (for example, away working, on holiday, in student accommodation or in hospital) were also entitled to vote in the local elections,[14] although those who have moved abroad and registered as overseas electors cannot vote in the local elections. Those who were registered to vote at more than one address (such as a university student who has a term-time address and lives at home during holidays) were entitled to vote in the local elections at each address, as long as they were not in the same local government area.[15][16]
Enacting legislation[edit]
These elections were held on 22 May 2014 as provided by ‘The Local Elections (Ordinary Day of Elections in 2014) Order 2013’ (S.I. 2013/2277).[12][17][18][19]
See also[edit]
- ^ Swing figures are between the BBC national projected vote share extrapolation from 2013 local elections, and the BBC equivalent vote share projection from these local elections held in different areas
- ^ a b England: 163 councillors (+161 net). Northern Ireland: 3 councillors (+2 net)
References[edit]
Recent Comments