List of parliamentary constituencies in Herefordshire and Worcestershire
From Wikipedia, the free encyclopedia
There are 8 Parliamentary constituencies in the ceremonial counties of Herefordshire and Worcestershire. From 1974 to 1998 the two counties were administratively and ceremonially one, called Hereford and Worcester, and the constituencies crossed the traditional county boundaries. This continued to be the case up to and including the 2005 general election, but since the 2010 general election two constituencies fall entirely within Herefordshire and six within Worcestershire. There are 2 borough constituencies and 6 county constituencies.
Constituencies[edit]
Conservative † Labour ‡ Liberal Democrat ¤
| Name[nb 1] | Electorate[1] | Majority[2][nb 2] | Member of Parliament[2] | Nearest opposition[2] | Map | ||
|---|---|---|---|---|---|---|---|
| Bromsgrove CC | 75,078 | 23,106 | Sajid Javid † | Rory Shannon ‡ |
 |
||
| Hereford and South Herefordshire CC | 72,085 | 19,686 | Jesse Norman † | Anna-Maria Coda ‡ |
 |
||
| North Herefordshire CC | 70,252 | 24,856 | Bill Wiggin † | Philip Howells ¤ |
 |
||
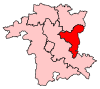
| Mid Worcestershire CC | 78,220 | 28,018 | Nigel Huddleston † | Helen Russell ‡ |
 |
||
| Redditch BC | 65,391 | 16,036 | Rachel Maclean † | Rebecca Jenkins ‡ |
 |
||
| West Worcestershire CC | 76,241 | 24,499 | Harriett Baldwin † | Beverley Nielsen ¤ |
 |
||
| Worcester BC | 73,485 | 6,758 | Robin Walker † | Lynn Denham ‡ |
 |
||
| Wyre Forest CC | 78,077 | 21,413 | Mark Garnier † | Robin Lunn ‡ |
 |
||
2010 boundary changes[edit]
Under the Fifth Periodic Review of Westminster constituencies, the Boundary Commission for England decided to retain 8 constituencies covering the counties of Herefordshire and Worcestershire for the 2010 election, making minor changes to take account of the separation of the two counties, to realign constituency boundaries with the boundaries of current local government wards, and to reduce the electoral disparity between constituencies. The constituencies of Hereford and Leominster were renamed Hereford and South Herefordshire, and North Herefordshire respectively.
Proposed boundary changes[edit]
See 2023 Periodic Review of Westminster constituencies for further details.
Following the abandonment of the Sixth Periodic Review (the 2018 review), the Boundary Commission for England formally launched the 2023 Review on 5 January 2021.[3] Initial proposals were published on 8 June 2021 and, following two periods of public consultation, revised proposals were published on 8 November 2022. Final proposals will be published by 1 July 2023.
The commission has proposed retaining the current two constituencies in Herefordshire, with minor boundary changes to reflect changes to ward boundaries. In Worcestershire, it is proposed to make a small transfer from Mid Worcestershire to Redditch to bring these two constituencies within the statutory range. It is proposed that Mid Worcestershire is renamed Droitwich and Evesham. The other four constituencies would be unchanged.[4]
Results history[edit]
Primary data source: House of Commons research briefing – General election results from 1918 to 2019[5]
2019[edit]
The number of votes cast for each political party who fielded candidates in constituencies comprising Herefordshire and Worcestershire in the 2019 general election were as follows:
Percentage votes[edit]
| Election year | 1983 | 1987 | 1992 | 1997 | 2001 | 2005 | 2010 | 2015 | 2017 | 2019 |
|---|---|---|---|---|---|---|---|---|---|---|
| Conservative | 52.3 | 51.8 | 50.8 | 41.0 | 41.1 | 42.9 | 45.9 | 51.7 | 58.1 | 61.8 |
| Labour | 15.3 | 17.9 | 24.6 | 32.6 | 27.4 | 24.5 | 16.7 | 19.7 | 28.9 | 21.8 |
| Liberal Democrat1 | 31.4 | 29.7 | 23.1 | 21.9 | 19.4 | 21.8 | 25.3 | 6.7 | 6.2 | 11.5 |
| Green Party | – | * | * | * | * | * | 1.0 | 4.5 | 2.6 | 4.6 |
| UKIP | – | – | – | * | * | * | 4.2 | 15.4 | 2.1 | * |
| Other | 1.0 | 0.6 | 1.5 | 4.5 | 12.1 | 10.8 | 6.8 | 1.9 | 2.1 | 0.3 |
11983 & 1987 – SDP-Liberal Alliance
* Included in Other
Seats[edit]
| Election year | 1983 | 1987 | 1992 | 1997 | 2001 | 2005 | 2010 | 2015 | 2017 | 2019 |
|---|---|---|---|---|---|---|---|---|---|---|
| Conservative | 7 | 7 | 7 | 4 | 4 | 4 | 8 | 8 | 8 | 8 |
| Labour | 0 | 0 | 0 | 3 | 2 | 2 | 0 | 0 | 0 | 0 |
| Liberal Democrat1 | 0 | 0 | 0 | 1 | 1 | 1 | 0 | 0 | 0 | 0 |
| Independent2 | – | – | – | – | 1 | 1 | 0 | – | – | – |
| Total | 7 | 7 | 7 | 8 | 8 | 8 | 8 | 8 | 8 | 8 |
11983 & 1987 – SDP-Liberal Alliance
2Dr Richard Taylor, standing as the Independent Kidderminster Hospital and Health Concern candidate
Maps[edit]
1885-1910[edit]


1918-1945[edit]


1950-1979[edit]


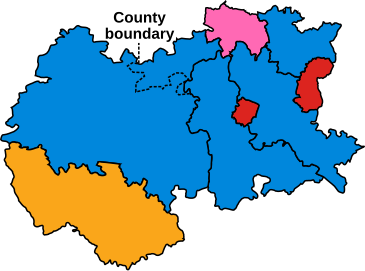
1983-2005 – Hereford and Worcester[edit]


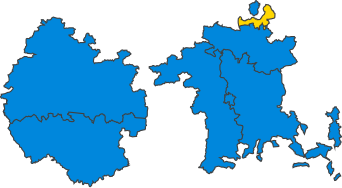
2010-present[edit]
Timeline[edit]
Green represents former constituencies, pink is for current ones.
Worcestershire[edit]
Herefordshire[edit]
Historical representation by party[edit]
A cell marked → (with a different colour background to the preceding cell) indicates that the previous MP continued to sit under a new party name.
1885 to 1918[edit]
Conservative Liberal Liberal Unionist
1918 to 1950[edit]
Conservative Independent Labour Liberal
1950 to 1983[edit]
The West Midlands Order 1965 transferred the Dudley area from Worcestershire to Staffordshire and part of the Warley area from Staffordshire to Worcestershire. These changes were incorporated into the new constituency boundaries for the February 1974 general election.
Conservative Labour
1983 to present[edit]
Conservative Health Concern Independent Conservative Labour Liberal Democrats
See also[edit]
- ^ BC denotes borough constituency, CC denotes county constituency.
- ^ The majority is the number of votes the winning candidate receives more than their nearest rival.
References[edit]
Recent Comments