List of districts in Northern Ireland by national identity
From Wikipedia, the free encyclopedia
|
|
Parts of this article (those related to 2021 Northern Irish Census and the post-2015 local government divisions) need to be updated. (October 2022) |

This is a list of local government districts in Northern Ireland by national identity.
In 2011 the decennial UK Census asked respondents for the first time “How would you describe your national identity?” In Northern Ireland respondents were given a list of options (including British, Irish, and Northern Irish) from which they could choose as many as they wanted.
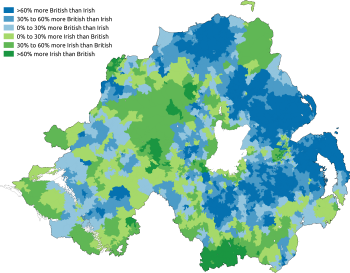
Irish national identity was numerically in a majority in two districts, Derry and Newry, where 55.03% and 52.09% respectively consider themselves as having an Irish national identity.[1] Whilst 45.14% of the population of Northern Ireland said that they were either Catholic or that they had been raised Catholic, only 28.35% described their nationality as Irish. In the Larne Borough Council area the percentage of Catholics was 24.87% and the figure for Irish nationality was 10.1%, meaning that no more (and almost certainly less) than 32.40% of Catholics described themselves as having an Irish nationality.[2]
British nationality was numerically in a majority in eleven districts. The fact that the overall number of people who described their nationality as British (48.41%) is very similar to the proportion who said that they were from a Protestant community background (48.36%) is not tantamount to proving that all Protestants see themselves primarily as British. In nine of Northern Ireland’s 26 council areas, British nationality was a higher proportion than the number of Protestants. For example, in the Down District Council the figure for British nationality (40.21%) is 123.38% of the figure for Protestants (32.08%), meaning that, even if every single Protestant were to have chosen a British nationality, a substantial amount of those choosing a British nationality were evidently not Protestant.
Northern Irish nationality was geographically evenly spread throughout the region. There was no strong correlation between Northern Irish nationality at local government level and religion or community background. For instance the two highest areas of Northern Irish national identity were Down (34.12%) and North Down (32.95%); the former being mostly Catholic (62.51%) and the latter being mostly Protestant (73.23%).
There was a British national identity majority or plurality over Irish nationality in 20 of the 26 council areas, and there was an Irish national identity majority or plurality over British national identity in 6 of the 26 council areas.
National Identity by District[edit]

National identity by religion or religion brought up in for each district[3]
| District | Catholic | Protestant and other Christian | Other Religion or None | |||||||||
|---|---|---|---|---|---|---|---|---|---|---|---|---|
| British | Irish | Northern Irish | All Other | British | Irish | Northern Irish | All Other | British | Irish | Northern Irish | All Other | |
| Antrim | 23.1% | 43.7% | 34.2% | 7.1% | 80.6% | 3.1% | 27.8% | 3.3% | 60.4% | 6.5% | 26.8% | 19.0% |
| Ards | 34.1% | 31.7% | 38.2% | 6.4% | 80.9% | 3.7% | 30.4% | 2.2% | 67.7% | 6.0% | 35.1% | 9.1% |
| Armagh | 7.1% | 62.5% | 28.7% | 6.2% | 81.6% | 3.6% | 25.7% | 2.3% | 49.3% | 10.5% | 25.1% | 25.3% |
| Ballymena | 24.6% | 38.9% | 34.7% | 11.0% | 83.6% | 2.7% | 25.7% | 2.5% | 62.3% | 6.5% | 28.4% | 14.4% |
| Ballymoney | 19.0% | 44.5% | 38.8% | 4.1% | 81.1% | 2.9% | 27.2% | 2.2% | 65.1% | 8.4% | 28.0% | 13.3% |
| Banbridge | 22.6% | 41.7% | 39.4% | 4.5% | 81.2% | 3.8% | 27.7% | 2.0% | 59.1% | 8.3% | 33.8% | 11.5% |
| Belfast | 11.7% | 64.3% | 25.0% | 5.6% | 78.3% | 5.5% | 28.7% | 3.6% | 47.7% | 13.3% | 27.5% | 26.3% |
| Carrickfergus | 41.1% | 24.6% | 35.6% | 10.7% | 82.0% | 3.0% | 29.2% | 2.4% | 68.3% | 5.3% | 33.7% | 8.5% |
| Castlereagh | 22.1% | 50.0% | 34.5% | 6.3% | 81.3% | 3.9% | 29.9% | 2.3% | 61.9% | 8.9% | 33.7% | 11.8% |
| Coleraine | 25.0% | 39.2% | 36.5% | 8.4% | 79.1% | 4.3% | 29.3% | 2.6% | 56.5% | 10.3% | 33.4% | 16.8% |
| Cookstown | 8.1% | 53.8% | 37.7% | 5.2% | 82.5% | 3.6% | 24.0% | 2.1% | 44.2% | 9.1% | 24.4% | 31.5% |
| Craigavon | 12.2% | 51.2% | 31.5% | 10.6% | 82.5% | 3.2% | 26.3% | 2.7% | 49.9% | 9.1% | 26.7% | 26.4% |
| Derry | 7.3% | 70.5% | 24.3% | 2.5% | 76.7% | 7.2% | 25.9% | 3.5% | 39.4% | 24.7% | 21.9% | 26.2% |
| Down | 20.1% | 47.4% | 37.1% | 2.9% | 77.4% | 5.6% | 28.7% | 3.6% | 52.1% | 14.4% | 32.1% | 16.7% |
| Dungannon and South Tyrone | 5.7% | 57.6% | 28.6% | 13.0% | 79.6% | 4.5% | 24.5% | 3.0% | 33.3% | 12.0% | 22.8% | 42.1% |
| Fermanagh | 11.4% | 56.2% | 32.4% | 4.8% | 77.1% | 6.2% | 25.5% | 3.0% | 43.4% | 16.8% | 24.0% | 28.1% |
| Larne | 38.8% | 30.6% | 37.7% | 3.0% | 81.7% | 3.0% | 28.6% | 2.5% | 64.1% | 6.5% | 35.4% | 12.1% |
| Limavady | 18.1% | 50.5% | 34.4% | 2.5% | 79.8% | 4.1% | 24.9% | 2.5% | 51.4% | 10.9% | 28.8% | 18.7% |
| Lisburn | 16.5% | 58.6% | 27.8% | 4.3% | 80.2% | 4.7% | 29.0% | 3.2% | 62.2% | 8.8% | 30.3% | 13.9% |
| Magherafelt | 6.5% | 62.1% | 33.0% | 3.8% | 82.4% | 4.2% | 23.1% | 2.3% | 46.9% | 13.4% | 30.2% | 22.1% |
| Moyle | 14.6% | 53.1% | 35.3% | 2.8% | 76.3% | 5.0% | 27.8% | 3.3% | 49.4% | 17.8% | 23.8% | 19.8% |
| Newry and Mourne | 7.1% | 64.7% | 28.0% | 5.0% | 76.3% | 5.8% | 26.8% | 3.8% | 34.6% | 22.8% | 22.1% | 28.9% |
| Newtownabbey | 24.7% | 46.1% | 34.1% | 5.7% | 80.9% | 3.4% | 30.1% | 1.7% | 63.1% | 7.3% | 32.1% | 12.3% |
| North Down | 37.1% | 31.5% | 36.1% | 9.7% | 78.8% | 5.2% | 31.9% | 3.4% | 63.7% | 7.9% | 35.7% | 11.6% |
| Omagh | 8.7% | 55.7% | 36.0% | 4.4% | 78.5% | 4.9% | 25.0% | 2.5% | 40.6% | 15.9% | 23.7% | 28.9% |
| Strabane | 8.9% | 57.4% | 35.4% | 2.6% | 79.2% | 4.7% | 25.2% | 1.9% | 40.9% | 21.1% | 25.5% | 26.4% |
New districts, 2015[edit]
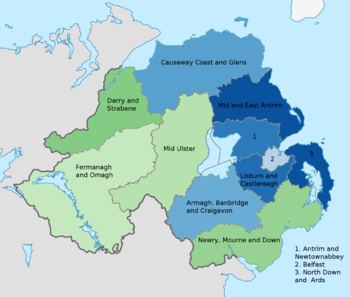
Following the reform of local government in Northern Ireland the twenty-six districts created in 1973 were replaced with eleven “super districts”. The first election using these districts took place on 22 May 2014, electing councillors who sat in shadow form until 1 April 2015. The breakdown of national identity within these new boundaries at the time of the 2011 census was as follows.[4][a]
- ^ Figures are correct as per source, but totals are over 100% as the ‘All usual residents’ figure used as the base figure for each district is less than the total of respondents to the question.[4]
See also[edit]
References[edit]
External links[edit]
Recent Comments