2019 Laois County Council election
before-content-x4
From Wikipedia, the free encyclopedia
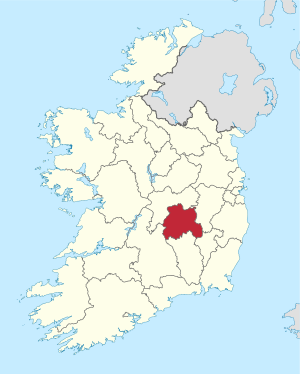
Map showing the area of Laois County Council |
|||
|
|||
A Laois County Council election was held in County Laois in Ireland on 24 May 2019 as part of that year’s local elections. 19 councillors were elected for a five-year term of office from 3 local electoral areas (LEAs) by single transferable vote. Following a recommendation of the 2018 LEA boundary review committee, the electoral division of Clash mas moved to Borris-in-Ossory—Mountmellick LEA from Portlaoise LEA, to take account of population changes revealed by the 2016 census.
Results by party[edit]
Results by local electoral area[edit]
Borris in Ossory–Mountmellick[edit]
| Party | Candidate | FPv% | Count | ||||||||||
|---|---|---|---|---|---|---|---|---|---|---|---|---|---|
| 1 | 2 | 3 | 4 | 5 | 6 | 7 | 8 | 9 | 10 | ||||
| Independent | James Kelly[c 1] | 12.72% | 1,517 | 1,576 | 1,606 | 1,629 | 1,648 | 1,811 | |||||
| Fianna Fáil | Paddy Bracken[c 1] | 11.86% | 1,414 | 1,418 | 1,500 | 1,565 | 1,752 | ||||||
| Fine Gael | John King[c 1] | 10.51% | 1,254 | 1,258 | 1,259 | 1,261 | 1,274 | 1,314 | 1,351 | 1,355 | 1,357 | 1,532 | |
| Independent | Ollie Clooney | 9.47% | 1,129 | 1,136 | 1,149 | 1,161 | 1,171 | 1,219 | 1,304 | 1,331 | 1,334 | 1,405 | |
| Fianna Fáil | Séamus McDonald[c 1] | 9.13% | 1,089 | 1,095 | 1,116 | 1,332 | 1,395 | 1,535 | 1,671 | 1,695 | 1,710 | ||
| Independent | Brendan Phelan[c 1] | 7.81% | 931 | 953 | 964 | 970 | 976 | 1,056 | 1,166 | 1,185 | 1,187 | 1,273 | |
| Fine Gael | Conor Bergin | 7.76% | 925 | 949 | 953 | 962 | 1,042 | 1,091 | 1,165 | 1,190 | 1,199 | 1,548 | |
| Fine Gael | David Goodwin[c 1] | 6.92% | 825 | 831 | 843 | 916 | 1,057 | 1,088 | 1,150 | 1,152 | 1,169 | ||
| Sinn Féin | Lorna Holohan Garry | 5.44% | 649 | 668 | 741 | 790 | 819 | 841 | |||||
| Fianna Fáil | Liam O’Neill | 4.82% | 575 | 587 | 594 | 624 | 637 | ||||||
| Fine Gael | Fergal Conroy | 4.69% | 559 | 561 | 594 | 621 | |||||||
| Fianna Fáil | Declan Good | 4.54% | 542 | 549 | 554 | ||||||||
| Independent | Brian Furlong | 2.73% | 326 | 331 | |||||||||
| Independent | Ger Hogan | 1.61% | 192 | ||||||||||
| Electorate: 20,704 Valid: 11,927 Spoilt: 168 Quota: 1,704 Turnout: 12,095 (58.42%) | |||||||||||||
Graiguecullen–Portarlington[edit]
| Party | Candidate | FPv% | Count | |||||||
|---|---|---|---|---|---|---|---|---|---|---|
| 1 | 2 | 3 | 4 | 5 | 6 | 7 | ||||
| Fianna Fáil | Padraig Fleming[c 1] | 17.33% | 1,761 | |||||||
| Sinn Féin | Aidan Mullins[c 1] | 15.88% | 1,614 | |||||||
| Fine Gael | Tom Mulhall[c 1] | 15.19% | 1,544 | |||||||
| Fianna Fáil | Paschal McEvoy[c 1] | 13.93% | 1,416 | 1,495 | ||||||
| Independent | Ben Brennan[c 1] | 12.50% | 1,270 | 1,350 | 1,387 | 1,392 | 1,433 | 1,445 | 1,525 | |
| Fine Gael | Aisling Moran | 8.81% | 895 | 964 | 972 | 995 | 1,031 | 1,047 | 1,398 | |
| Labour | Eoin Barry | 7.44% | 756 | 792 | 826 | 833 | 880 | 882 | 998 | |
| Fine Gael | Vivienne Phelan | 5.33% | 542 | 566 | 586 | 625 | 737 | 749 | ||
| Fianna Fáil | Deirdre Ó Connell-Hopkins | 3.59% | 365 | 386 | 449 | 467 | ||||
| Electorate: 20,541 Valid: 10,163 Spoilt: 147 Quota: 1,452 Turnout: 10,310 (50.19%) | ||||||||||
Portlaoise[edit]
| Party | Candidate | FPv% | Count | ||||||||||||||
|---|---|---|---|---|---|---|---|---|---|---|---|---|---|---|---|---|---|
| 1 | 2 | 3 | 4 | 5 | 6 | 7 | 8 | 9 | 10 | 11 | 12 | 13 | 14 | ||||
| Fine Gael | Willie Aird[c 1] | 15.39% | 1,573 | ||||||||||||||
| Fianna Fáil | John Joe Fennelly[c 1] | 14.25% | 1,456 | ||||||||||||||
| Sinn Féin | Caroline Dwane Stanley[c 1] | 11.84% | 1,210 | 1,229 | 1,241 | 1,252 | 1,334 | ||||||||||
| Fianna Fáil | Catherine Fitzgerald[c 1] | 10.57% | 1,080 | 1,129 | 1,166 | 1,173 | 1,177 | 1,180 | 1,184 | 1,206 | 1,288 | ||||||
| Labour | Noel Tuohy[c 1] | 10.19% | 1,041 | 1,073 | 1,080 | 1,106 | 1,116 | 1,122 | 1,135 | 1,170 | 1,244 | 1,284 | |||||
| Fine Gael | Mary Sweeney[c 1] | 10.02% | 1,024 | 1,100 | 1,159 | 1,178 | 1,189 | 1,195 | 1,211 | 1,213 | 1,251 | 1,269 | 1,271 | 1,369 | |||
| Independent | Naeem Iqbal | 4.44% | 454 | 456 | 458 | 468 | 468 | 472 | 477 | 493 | 503 | 590 | 591 | 628 | 638 | ||
| Fine Gael | Thomasina Connell | 4.28% | 437 | 503 | 516 | 519 | 525 | 527 | 533 | 535 | 567 | 612 | 613 | 679 | 703 | 796 | |
| Renua | Dominic Dunne | 3.71% | 379 | 395 | 401 | 411 | 415 | 419 | 493 | 511 | 542 | 558 | 559 | 636 | 654 | 743 | |
| Independent | Timothy Adejumo | 3.55% | 363 | 365 | 368 | 374 | 374 | 381 | 383 | 401 | 411 | ||||||
| Fianna Fáil | Donal Kelly | 3.24% | 331 | 342 | 354 | 359 | 359 | 362 | 369 | 381 | 443 | 466 | 471 | ||||
| Fianna Fáil | Pauline Madigan[c 2] | 3.19% | 326 | 339 | 354 | 355 | 355 | 356 | 359 | 366 | |||||||
| Independent | Tom Duffy | 1.51% | 154 | 155 | 156 | 164 | 167 | 172 | 173 | ||||||||
| Renua | Noel O’Rourke | 1.32% | 135 | 137 | 140 | 148 | 150 | 151 | |||||||||
| Sinn Féin | John Gormley | 1.28% | 131 | 134 | 140 | 141 | |||||||||||
| Independent | Judith Preston-Grace | 1.22% | 125 | 128 | 130 | ||||||||||||
| Electorate: 21,162 Valid: 10,219 Spoilt: 151 Quota: 1,278 Turnout: 10,370 (49%) | |||||||||||||||||
Results by gender[edit]
| 2019 Laois County Council election[7] Candidates by gender |
||||
|---|---|---|---|---|
| Gender | Number of candidates |
% of candidates |
Elected councillors |
% of councillors |
| Men | 29 | 74.4% | 14 | 73.7% |
| Women | 10 | 25.6% | 5 | 26.3% |
| TOTAL | 39 | 19 | ||
- ^ a b c d e f g h i j k l m n o p q Outgoing councillor elected in 2014.
- ^ Outgoing councillor coopted subsequent to the 2014 election.
Sources[edit]
References[edit]
after-content-x4
Recent Comments