2018 Dutch Intelligence and Security Services Act referendum
From Wikipedia, the free encyclopedia
 |
|||||||||||||||||||||||||
|
|||||||||||||||||||||||||
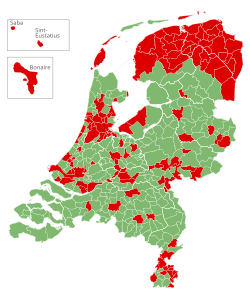 Results by municipality For Against |
|||||||||||||||||||||||||
An advisory referendum on the Intelligence and Security Services Act 2017 (Dutch: Wet op de inlichtingen- en veiligheidsdiensten 2017, abbreviated ‘Wiv’) was held in the Netherlands on 21 March 2018, alongside the municipal elections. It was the second referendum to be held under the Dutch Advisory Referendum Act after the 2016 Ukraine–European Union Association Agreement referendum.
A plurality of voters (49.44%) voted against the law, resulting in its rejection. Voter turnout was 51.5%, above the 30% threshold for validation of the result.[1] Although the referendum itself was non-binding, Prime Minister Mark Rutte had promised to take a potential “no” vote into account prior to the referendum.[2]
Background[edit]
The draft Intelligence and Security Agencies Act 2017 was laid before the States General by the Government of the Netherlands at the end of 2016. On 14 February 2017, a majority in the House of Representatives voted in support of the act,[3] which was then approved in the Senate on 11 July.[4] Although a referendum will be held, the government has indicated it plans for the law to nevertheless to go into effect on 1 May 2018.[5]
Request[edit]
| Stage | Required | Received | Valid |
|---|---|---|---|
| Preliminary requests | 10,000 | 19,266 | 17,162[6] |
| Definitive requests | 300,000 | 417,354 | 384,126[7] |
A campaign to obtain sufficient support declarations for a referendum was initiated by a group of students at the University of Amsterdam concerned about the sweeping surveillance powers granted to the General Intelligence and Security Service (AIVD) under the law.[5] On 1 November 2017, the Electoral Council (Kiesraad) announced that a sufficient number of signatures had been collected to trigger an advisory referendum on the tapping law, with 384,126 valid signatures, over 92 percent of those collected, well above the 300,000 required for a referendum.[8]
Party positions[edit]
The referendum comes after the formation of the Third Rutte cabinet following the 2017 general election,[8] with the coalition divided whether to hold a referendum on the law, Democrats 66 (D66) being the only one of the four coalition parties that voted against disregarding the result ahead of the referendum.[9]
The party positions listed below are based on the vote of the law in the House of Representatives on 14 February 2017, with the exception of Forum for Democracy (FvD), which was not represented in the lower chamber before the 2017 general election.[10]
* PVV announced that even though they voted in favour, they would respect the outcome of the referendum.
Opinion polls[edit]
Vote in referendum[edit]
Support for the law[edit]
| Polling firm | Date | For | Against | Don’t know | Lead |
|---|---|---|---|---|---|
| GfK | 31 Oct 2017 | 34 | 53 | 13 | 19 |
| GfK | 23 Oct 2017 | 40 | 49 | 11 | 9 |
Results[edit]

| Choice | Votes | % | |
|---|---|---|---|
| For | 3,122,628 | 46.53 | |
| Against | 3,317,496 | 49.44 | |
| Blank | 270,288 | 4.03 | |
| Invalid votes | 23,813 | – | |
| Total | 6,734,225 | 100 | |
| Registered voters/turnout | 13,064,932 | 51.54 | |
| Source: Kiesraad | |||
Results by province or territory[edit]
| Province or territory | Electorate | Voter turnout | In favour | Against | Blank | |||
|---|---|---|---|---|---|---|---|---|
| Votes | % | Votes | % | Votes | % | |||
| 387,611 | 54.16 | 99,787 | 47.72 | 100,850 | 48.23 | 8,472 | 4.05 | |
| 297,206 | 50.28 | 67,377 | 45.24 | 77,168 | 51.81 | 4,390 | 2.95 | |
| 504,855 | 42.80 | 97,594 | 45.30 | 111,049 | 51.55 | 6,779 | 3.15 | |
| 1,602,016 | 54.19 | 415,207 | 48.01 | 411,924 | 47.63 | 37,737 | 4.36 | |
| 458,131 | 37.22 | 61,200 | 35.97 | 105,009 | 61.72 | 3,916 | 2.30 | |
| 873,201 | 50.23 | 206,901 | 47.33 | 209,891 | 48.02 | 20,310 | 4.65 | |
| 1,947,973 | 48.43 | 469,115 | 49.90 | 430,932 | 45.84 | 40,032 | 4.26 | |
| 2,075,436 | 52.87 | 453,840 | 41.51 | 598,606 | 54.75 | 40,927 | 3.74 | |
| 882,344 | 56.92 | 247,309 | 49.41 | 230,930 | 46.14 | 22,311 | 4.46 | |
| 969,421 | 57.65 | 253,208 | 45.46 | 278,935 | 50.08 | 24,863 | 4.46 | |
| 291,514 | 56.70 | 88,950 | 54.02 | 69,174 | 42.01 | 6,536 | 3.97 | |
| 2,760,065 | 51.22 | 661,822 | 47.00 | 692,443 | 49.17 | 54,009 | 3.84 | |
| 15,159 | 6.06 | 318 | 34.98 | 585 | 64.36 | 6 | 0.66 | |
| Source: Kiesraad | ||||||||
References[edit]
External links[edit]
Recent Comments