2018 Polish local elections – Wikipedia
From Wikipedia, the free encyclopedia
| Turnout | 54.90% |
|---|---|
The 2018 Polish local elections were held on October 21 for all 16 provincial (voivodeship, województwo) assemblies, 380 county (powiat) councils, and 2477 commune (gmina) councils. There were also direct elections for commune heads (mayors and city presidents), with a second, run-off round for these offices on November 4.
The local elections were a victory of the ruling Law and Justice (PiS), though the opposition Civic Coalition (KO) maintained control of the majority of cities, including the capital Warsaw.
National[edit]
Notes:
Voivodeship councils[edit]
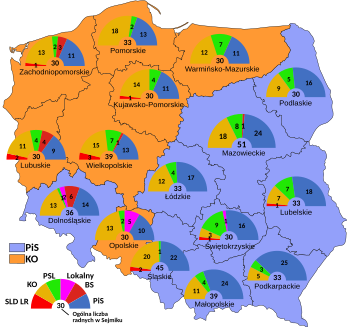
Election results (%)[edit]
| Voivodeship
Council |
||||||||||||
|---|---|---|---|---|---|---|---|---|---|---|---|---|
| PiS | KO | PSL | SLD | K’15 | BS | Liberty | Razem | RN | The Greens | Regional committees | Other | |
| Lower Silesia[2] | 28,53 | 25,77 | 5,23 | 5,50 | 4,78 | 14,98 | 1,38 | 1,61 | 1,32 | 1,76 | 8,291 | 0,86 |
| Kuyavia-Pomerania[3] | 28,27 | 34,66 | 14,31 | 9,00 | 5,70 | 0,64 | 1,98 | 1,77 | 0,54 | 1,19 | — | 1,94 |
| Lublin[4] | 44,04 | 18,19 | 19,30 | 5,89 | 6,64 | 0,42 | 1,62 | 0,93 | 1,32 | 0,14 | — | 1,51 |
| Lubusz[5] | 25,11 | 29,92 | 12,43 | 9,59 | 3,22 | 13,17 | 0,55 | 1,72 | 1,67 | 2,62 | — | — |
| Łódź[6] | 34,88 | 28,39 | 13,06 | 6,32 | 5,86 | 3,90 | 1,38 | 1,72 | 1,17 | 1,34 | — | 1,98 |
| Lesser Poland[7] | 43,55 | 22,66 | 10,03 | 2,87 | 5,76 | 3,89 | 1,80 | 1,44 | 0,86 | 1,02 | — | 6,14 |
| Masovia[8] | 34,04 | 27,66 | 13,15 | 5,46 | 5,44 | 6,24 | 1,51 | 1,70 | 1,24 | 1,38 | — | 2,16 |
| Opole[9] | 25,77 | 29,45 | 10,72 | 5,94 | 6,06 | 0,78 | 1,54 | 1,51 | 0,95 | 0,45 | 14,642 | 2,19 |
| Subcarpathian[10] | 52,25 | 13,44 | 11,88 | 5,85 | 6,62 | 3,39 | 1,77 | 1,08 | 1,92 | 0,63 | — | 1,16 |
| Podlaskie[11] | 41,64 | 24,14 | 15,66 | 4,78 | 5,90 | 1,20 | 1,04 | 1,24 | 1,36 | 0,44 | — | 2,60 |
| Pomerania[12] | 27,84 | 40,70 | 8,33 | 6,59 | 5,24 | 3,03 | 2,83 | 2,21 | 1,64 | 1,59 | — | — |
| Silesia[13] | 32,11 | 28,83 | 5,15 | 8,31 | 6,58 | 4,96 | 1,43 | 1,46 | 1,16 | 1,39 | — | 8,62 |
| Świętokrzyskie[14] | 38,40 | 11,79 | 25,52 | 6,16 | 4,90 | 2,78 | 1,84 | 0,77 | 1,16 | 0,43 | 5,263 | 0,98 |
| Warmia-Masuria[15] | 28,15 | 30,40 | 19,64 | 8,16 | 6,29 | 0,79 | 0,48 | 2,31 | 2,65 | 0,45 | — | 0,70 |
| Greater Poland[16] | 27,84 | 29,66 | 14,52 | 9,31 | 5,23 | 6,08 | 1,53 | 1,78 | 1,26 | 1,56 | — | 1,23 |
| West Pomerania[17] | 26,80 | 32,04 | 9,68 | 9,08 | 4,21 | 13,70 | 1,94 | 1,53 | 0,73 | 0,30 | — | — |
| Poland[18] | 34,13 | 26,97 | 12,07 | 6,62 | 5,63 | 5,28 | 1,59 | 1,57 | 1,26 | 1,15 | 1,13 | 2,60 |
Seats Distribution[edit]
County councils[edit]
Municipal councils[edit]
| Election committee | Municipal councils above 20 000 inhabitants | Municipal councils under 20 000 inhabitants | |||
| % votes[19] | Number of seats[19] | % votes[19] | Number of seats[20] | ||
|---|---|---|---|---|---|
| Law and Justice | 25,20 | 1877 | 15,72 | 3931 | |
| Platform.Modern Civic Coalition | 19,41 | 932 | 0,80 | 166 | |
| Polish People’s Party | 1,19 | 123 | 8,52 | 3077 | |
| SLD Left Together | 3,70 | 107 | 0,82 | 200 | |
| Nonpartisan Local Government Activists | 0,80 | 22 | 0,13 | 31 | |
| Kukiz’15 | 2,37 | 18 | 0,48 | 75 | |
| Liberty in Local Governments | 0,18 | – | 0,02 | 3 | |
| National Movement | 0,01 | – | 0,02 | 1 | |
References[edit]
External links[edit]
Recent Comments