2020 United States presidential election in Wyoming
From Wikipedia, the free encyclopedia
Election in Wyoming
| Turnout | 62.6% |
|||
|---|---|---|---|---|

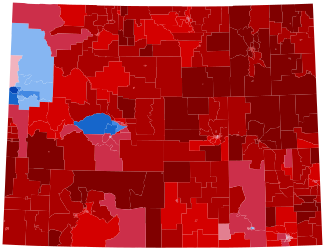
County results
|
||||
Precinct results
|
||||
|
|
||||
The 2020 United States presidential election in Wyoming was held on Tuesday, November 3, 2020, as part of the 2020 United States presidential election in which all 50 states and the District of Columbia participated.[2]Wyoming voters chose electors to represent them in the Electoral College via a popular vote, pitting the Republican Party’s nominee, incumbent President Donald Trump and running mate Vice President Mike Pence, against Democratic Party nominee, former Vice President Joe Biden and his running mate California Senator Kamala Harris. Wyoming has three electoral votes in the Electoral College.[3] Trump, the Republican nominee and incumbent president of the United States, won the state’s three electoral votes.
Trump routed Biden in Wyoming, with his 69.94% vote share there making it his strongest win in the election. He won the sparsely populated state by a margin of 43.39%, down from his 46.29% four years earlier. Prior to the election, all news organizations declared Wyoming a safe red state, therefore justifying its status as one of the safest red states in the country, not being won by a Democrat since Lyndon B. Johnson’s 1964 landslide victory. Trump’s 69.94% of the vote is the second-highest ever by a presidential candidate in Wyoming, only surpassed by Ronald Reagan during his 1984 landslide.
Despite his loss, Biden scored a landslide win in Teton County, garnering a larger vote share in it than any nominee since 1984. He also narrowly flipped the bellwether of Albany County, anchored by the college town of Laramie, which had supported Obama in 2008 before returning to the Republican Party in 2012 and 2016, albeit by a narrow margin.[4] Per exit polls by the Associated Press, Trump’s strength in Wyoming came from whites, who comprised 89% of the electorate, and from voters prioritizing energy policy, with 62% believing the government should focus on expanding production of fossil fuels such as oil, gas, or coal.[5]
Caucuses[edit]
Democratic caucuses[edit]
The Democratic caucuses were originally scheduled for April 4, 2020. On March 22, due to concerns over the COVID-19 pandemic, the Wyoming Democratic Party canceled in-person voting in favor of mail-in voting. The deadline was also extended to April 17.[6]
| Candidate | Votes | % | Delegates[8] |
|---|---|---|---|
| Joe Biden | 10,912 | 72.2% | 12 |
| Bernie Sanders (suspended) | 4,206 | 27.8% | 2 |
| Total | 15,118 | 100% | 14 |
Republican caucuses[edit]
The Republican state party convention was held in May to officially select the final delegates to the national convention.[9]
Libertarian nominee[edit]
- Jo Jorgensen, Psychology Senior Lecturer at Clemson University
General election[edit]
Predictions[edit]
| Source | Ranking | As of |
|---|---|---|
| The Cook Political Report[10] | Safe R | November 3, 2020 |
| Inside Elections[11] | Safe R | November 3, 2020 |
| Sabato’s Crystal Ball[12] | Safe R | November 3, 2020 |
| Politico[13] | Safe R | November 3, 2020 |
| RCP[14] | Safe R | November 3, 2020 |
| Niskanen[15] | Safe R | November 3, 2020 |
| CNN[16] | Safe R | November 3, 2020 |
| The Economist[17] | Safe R | November 3, 2020 |
| CBS News[18] | Likely R | November 3, 2020 |
| 270towin[19] | Safe R | November 3, 2020 |
| ABC News[20] | Safe R | November 3, 2020 |
| NPR[21] | Likely R | November 3, 2020 |
| NBC News[22] | Safe R | November 3, 2020 |
| 538[23] | Safe R | November 3, 2020 |
Polling[edit]
Graphical summary[edit]
Aggregate polls[edit]
Polls[edit]
Polls with a sample size of <100 have their sample size entries marked in red to indicate a lack of reliability.
Electoral slates[edit]
These slates of electors were nominated by each party in order to vote in the Electoral College should their candidate win the state:[24]
Results[edit]
By county[edit]
| County | Joe Biden Democratic |
Donald Trump Republican |
Jo Jorgensen Libertarian |
Brock Pierce Independent |
Write-in | Margin | Total votes | ||||||
|---|---|---|---|---|---|---|---|---|---|---|---|---|---|
| # | % | # | % | # | % | # | % | # | % | # | % | ||
| Albany | 9,092 | 48.84% | 8,579 | 46.08% | 595 | 3.20% | 178 | 0.96% | 173 | 0.93% | −513 | −2.76% | 18,617 |
| Big Horn | 788 | 13.70% | 4,806 | 83.55% | 74 | 1.29% | 46 | 0.80% | 38 | 0.66% | 4,018 | 69.85% | 5,752 |
| Campbell | 1,935 | 9.89% | 16,975 | 86.76% | 434 | 2.22% | 120 | 0.61% | 102 | 0.52% | 15,040 | 76.87% | 19,566 |
| Carbon | 1,427 | 21.41% | 5,014 | 75.24% | 142 | 2.13% | 49 | 0.74% | 32 | 0.48% | 3,587 | 53.83% | 6,664 |
| Converse | 861 | 12.35% | 5,917 | 84.89% | 121 | 1.74% | 43 | 0.62% | 28 | 0.40% | 5,056 | 72.54% | 6,970 |
| Crook | 378 | 9.18% | 3,651 | 88.64% | 57 | 1.38% | 19 | 0.46% | 14 | 0.34% | 3,273 | 79.46% | 4,119 |
| Fremont | 5,519 | 30.47% | 12,007 | 66.30% | 321 | 1.77% | 157 | 0.87% | 107 | 0.59% | 6,488 | 35.83% | 18,111 |
| Goshen | 1,203 | 19.28% | 4,878 | 78.16% | 86 | 1.38% | 43 | 0.69% | 31 | 0.50% | 3,675 | 58.88% | 6,241 |
| Hot Springs | 482 | 18.70% | 1,999 | 77.57% | 61 | 2.37% | 24 | 0.93% | 11 | 0.43% | 1,517 | 58.87% | 2,577 |
| Johnson | 897 | 18.25% | 3,881 | 78.98% | 86 | 1.75% | 27 | 0.55% | 23 | 0.47% | 2,984 | 60.72% | 4,914 |
| Laramie | 15,217 | 33.83% | 27,891 | 62.00% | 1,063 | 2.36% | 491 | 1.09% | 320 | 0.71% | 12,674 | 28.18% | 44,982 |
| Lincoln | 1,509 | 14.42% | 8,643 | 82.57% | 167 | 1.60% | 71 | 0.68% | 78 | 0.75% | 7,134 | 68.15% | 10,468 |
| Natrona | 8,530 | 24.23% | 25,271 | 71.79% | 895 | 2.54% | 294 | 0.84% | 212 | 0.60% | 16,741 | 47.56% | 35,202 |
| Niobrara | 155 | 11.85% | 1,118 | 85.47% | 21 | 1.61% | 11 | 0.84% | 3 | 0.23% | 963 | 73.62% | 1,308 |
| Park | 3,410 | 20.40% | 12,813 | 76.65% | 282 | 1.69% | 97 | 0.58% | 115 | 0.69% | 9,403 | 56.25% | 16,717 |
| Platte | 890 | 18.08% | 3,898 | 79.18% | 65 | 1.32% | 49 | 1.00% | 21 | 0.43% | 3,008 | 61.10% | 4,923 |
| Sheridan | 4,043 | 24.61% | 11,843 | 72.09% | 339 | 2.06% | 114 | 0.69% | 89 | 0.54% | 7,800 | 47.48% | 16,428 |
| Sublette | 882 | 17.75% | 3,957 | 79.62% | 71 | 1.43% | 37 | 0.74% | 23 | 0.46% | 3,075 | 61.87% | 4,970 |
| Sweetwater | 3,823 | 23.03% | 12,229 | 73.66% | 350 | 2.11% | 118 | 0.71% | 83 | 0.50% | 8,406 | 50.63% | 16,603 |
| Teton | 9,848 | 67.10% | 4,341 | 29.58% | 255 | 1.74% | 89 | 0.61% | 144 | 0.98% | −5,507 | −37.52% | 14,677 |
| Uinta | 1,591 | 16.92% | 7,496 | 79.73% | 172 | 1.83% | 79 | 0.84% | 64 | 0.68% | 5,905 | 62.81% | 9,402 |
| Washakie | 651 | 16.23% | 3,245 | 80.88% | 65 | 1.62% | 32 | 0.80% | 19 | 0.47% | 2,594 | 64.66 | 4,012 |
| Weston | 360 | 10.16% | 3,107 | 87.72% | 46 | 1.30% | 20 | 0.56% | 9 | 0.25% | 2,747 | 77.56% | 3,542 |
| Total | 73,491 | 26.55% | 193,559 | 69.94% | 5,768 | 2.08% | 2,208 | 0.80% | 1,739 | 0.63% | 120,068 | 43.38% | 276,765 |

| Democratic
Hold Gain from Republican |
Republican
Hold |
Counties that flipped from Republican to Democratic[edit]
By congressional district[edit]
Due to the state’s low population, only one congressional district is allocated. This district is called the At-Large district, because it covers the entire state, and thus is equivalent to the statewide election results.
See also[edit]
- ^ Calculated by taking the difference of 100% and all other candidates combined.
- ^ Key:
A – all adults
RV – registered voters
LV – likely voters
V – unclear - ^ Overlapping sample with the previous SurveyMonkey/Axios poll, but more information available regarding sample size
References[edit]
- ^ “Wyoming Voter Registration and Voter Turnout Statistics” (PDF). sos.wyo.gov/. Retrieved November 11, 2020.
- ^ Kelly, Ben (August 13, 2018). “US elections key dates: When are the 2018 midterms and the 2020 presidential campaign?”. The Independent. Archived from the original on August 2, 2018. Retrieved January 3, 2019.
- ^ “Distribution of Electoral Votes”. National Archives and Records Administration. Retrieved January 3, 2019.
- ^ “County winners, 1836-2016”. Google Docs. Retrieved November 20, 2020.
- ^ “Wyoming Voter Surveys: How Different Groups Voted”. The New York Times. November 3, 2020. ISSN 0362-4331. Retrieved November 17, 2020.
- ^ “Wyoming Democratic Caucus moves to only mail-in voting”. Wyoming Tribune Eagle. March 22, 2020.
- ^ “2020 Caucus Results”. www.wyodems.org. Wyoming Democratic Party. Archived from the original on September 13, 2020. Retrieved April 19, 2020.
- ^ “Delegate Tracker”. interactives.ap.org. Associated Press. Retrieved April 19, 2020.
- ^ “Wyoming Republican Delegation 2020”. The Green Papers. Retrieved February 21, 2020.
- ^ “2020 POTUS Race ratings” (PDF). The Cook Political Report. Retrieved May 21, 2019.
- ^ “POTUS Ratings | Inside Elections”. insideelections.com. Retrieved May 21, 2019.
- ^ “Larry J. Sabato’s Crystal Ball » 2020 President”. crystalball.centerforpolitics.org. Retrieved May 21, 2019.
- ^ “2020 Election Forecast”. Politico. November 19, 2019.
- ^ “Battle for White House”. RCP. April 19, 2019.
- ^ 2020 Bitecofer Model Electoral College Predictions Archived April 23, 2020, at the Wayback Machine, Niskanen Center, March 24, 2020, retrieved: April 19, 2020.
- ^ David Chalian; Terence Burlij (June 11, 2020). “Road to 270: CNN’s debut Electoral College map for 2020”. CNN. Retrieved June 16, 2020.
- ^ “Forecasting the US elections”. The Economist. Retrieved July 7, 2020.
- ^ “2020 Election Battleground Tracker”. CBS News. July 12, 2020. Retrieved July 13, 2020.
- ^ “2020 Presidential Election Interactive Map”. 270 to Win.
- ^ “ABC News Race Ratings”. CBS News. July 24, 2020. Retrieved July 24, 2020.
- ^ Montanaro, Domenico (August 3, 2020). “2020 Electoral Map Ratings: Trump Slides, Biden Advantage Expands Over 270 Votes”. NPR.org. Retrieved August 3, 2020.
- ^ “Biden dominates the electoral map, but here’s how the race could tighten”. NBC News. Retrieved August 6, 2020.
- ^ “2020 Election Forecast”. FiveThirtyEight. August 12, 2020. Retrieved August 14, 2020.
- ^ “2020 Presidential Electors Information” (PDF). Wyoming Secretary of State. Retrieved December 6, 2020.
- ^ “Statewide Candidates Official Summary Wyoming General Election – November 3, 2020” (PDF). sos.wyo.gov/. Retrieved November 11, 2020.
External links[edit]
Recent Comments